
- What is VWAP and what does it actually measure?
- How is VWAP calculated?
- What is the difference between session VWAP and anchored VWAP?
- Where should you anchor it?
- How do you add VWAP and anchored VWAP on TradingView?
- What are the three VWAP setups traders study?
- How does the trend pullback work?
- How does the VWAP reclaim work?
- How does the stretch-and-revert fade work?
- How does a VWAP trade look with real numbers?
- An anchored VWAP swing example
- What are the most common VWAP mistakes?
- Should you use VWAP with volume profile?
- Which tools help you trade with VWAP?
- Test yourself: a 5-question VWAP quiz
- FAQ
- Does VWAP work on all chart timeframes?
- What is the difference between VWAP and a simple moving average?
- Does VWAP predict future price movement?
- Why do large trading desks care about VWAP?
- What settings should you use for VWAP bands?
- Can you use VWAP for swing trading?
- The verdict
Trading involves substantial risk of loss, and most retail traders lose money. This article is education, not financial advice.
Disclosure: this article contains affiliate links. If you sign up through them, Trader Edge Hub may earn a commission at no extra cost to you. We only mention tools we think fit the topic.
A disciplined vwap trading strategy starts with one question: where did the volume actually trade? Many traders lean on simple moving averages, which treat a quiet lunchtime bar the same as a busy opening bar. This guide shows you how VWAP and anchored VWAP fix that, how to calculate them, where to anchor them, and three setups you can study on historical charts. You will also get a worked example with a $5,000 account and the mistakes that cost beginners the most.
Quick answer: VWAP (volume-weighted average price) is the average price paid since a starting point, weighted by how much traded at each price. Session VWAP resets at each day's open; anchored VWAP (AVWAP) runs continuously from a bar you choose. Comparing price with both lines shows whether today's traders or event-driven buyers are in control.
What is VWAP and what does it actually measure?
VWAP measures the true average transaction price over a chosen period. Unlike a simple moving average (SMA, an unweighted average of prices), VWAP weights every bar by its volume. Heavy-volume periods pull the line towards their prices. Light-volume periods barely move it.
Large firms use VWAP as an execution benchmark. A desk filling a big order splits it into smaller orders through the day, and the broker's work is graded against the session's VWAP. Buying below VWAP counts as a good fill for a buyer; buying above it means paying more than the average participant.
Retail day traders use the same line differently, as a live reference for fair value. When price trades above VWAP, the average buyer today is in profit. When price trades below it, the average buyer is underwater. Keep the two uses apart: one grades execution after the fact, the other helps you read who is in control right now.
Pro tip: Read VWAP as a scoreboard rather than a signal. "The average buyer is winning" is more useful information than "above the line is bullish".
How is VWAP calculated?
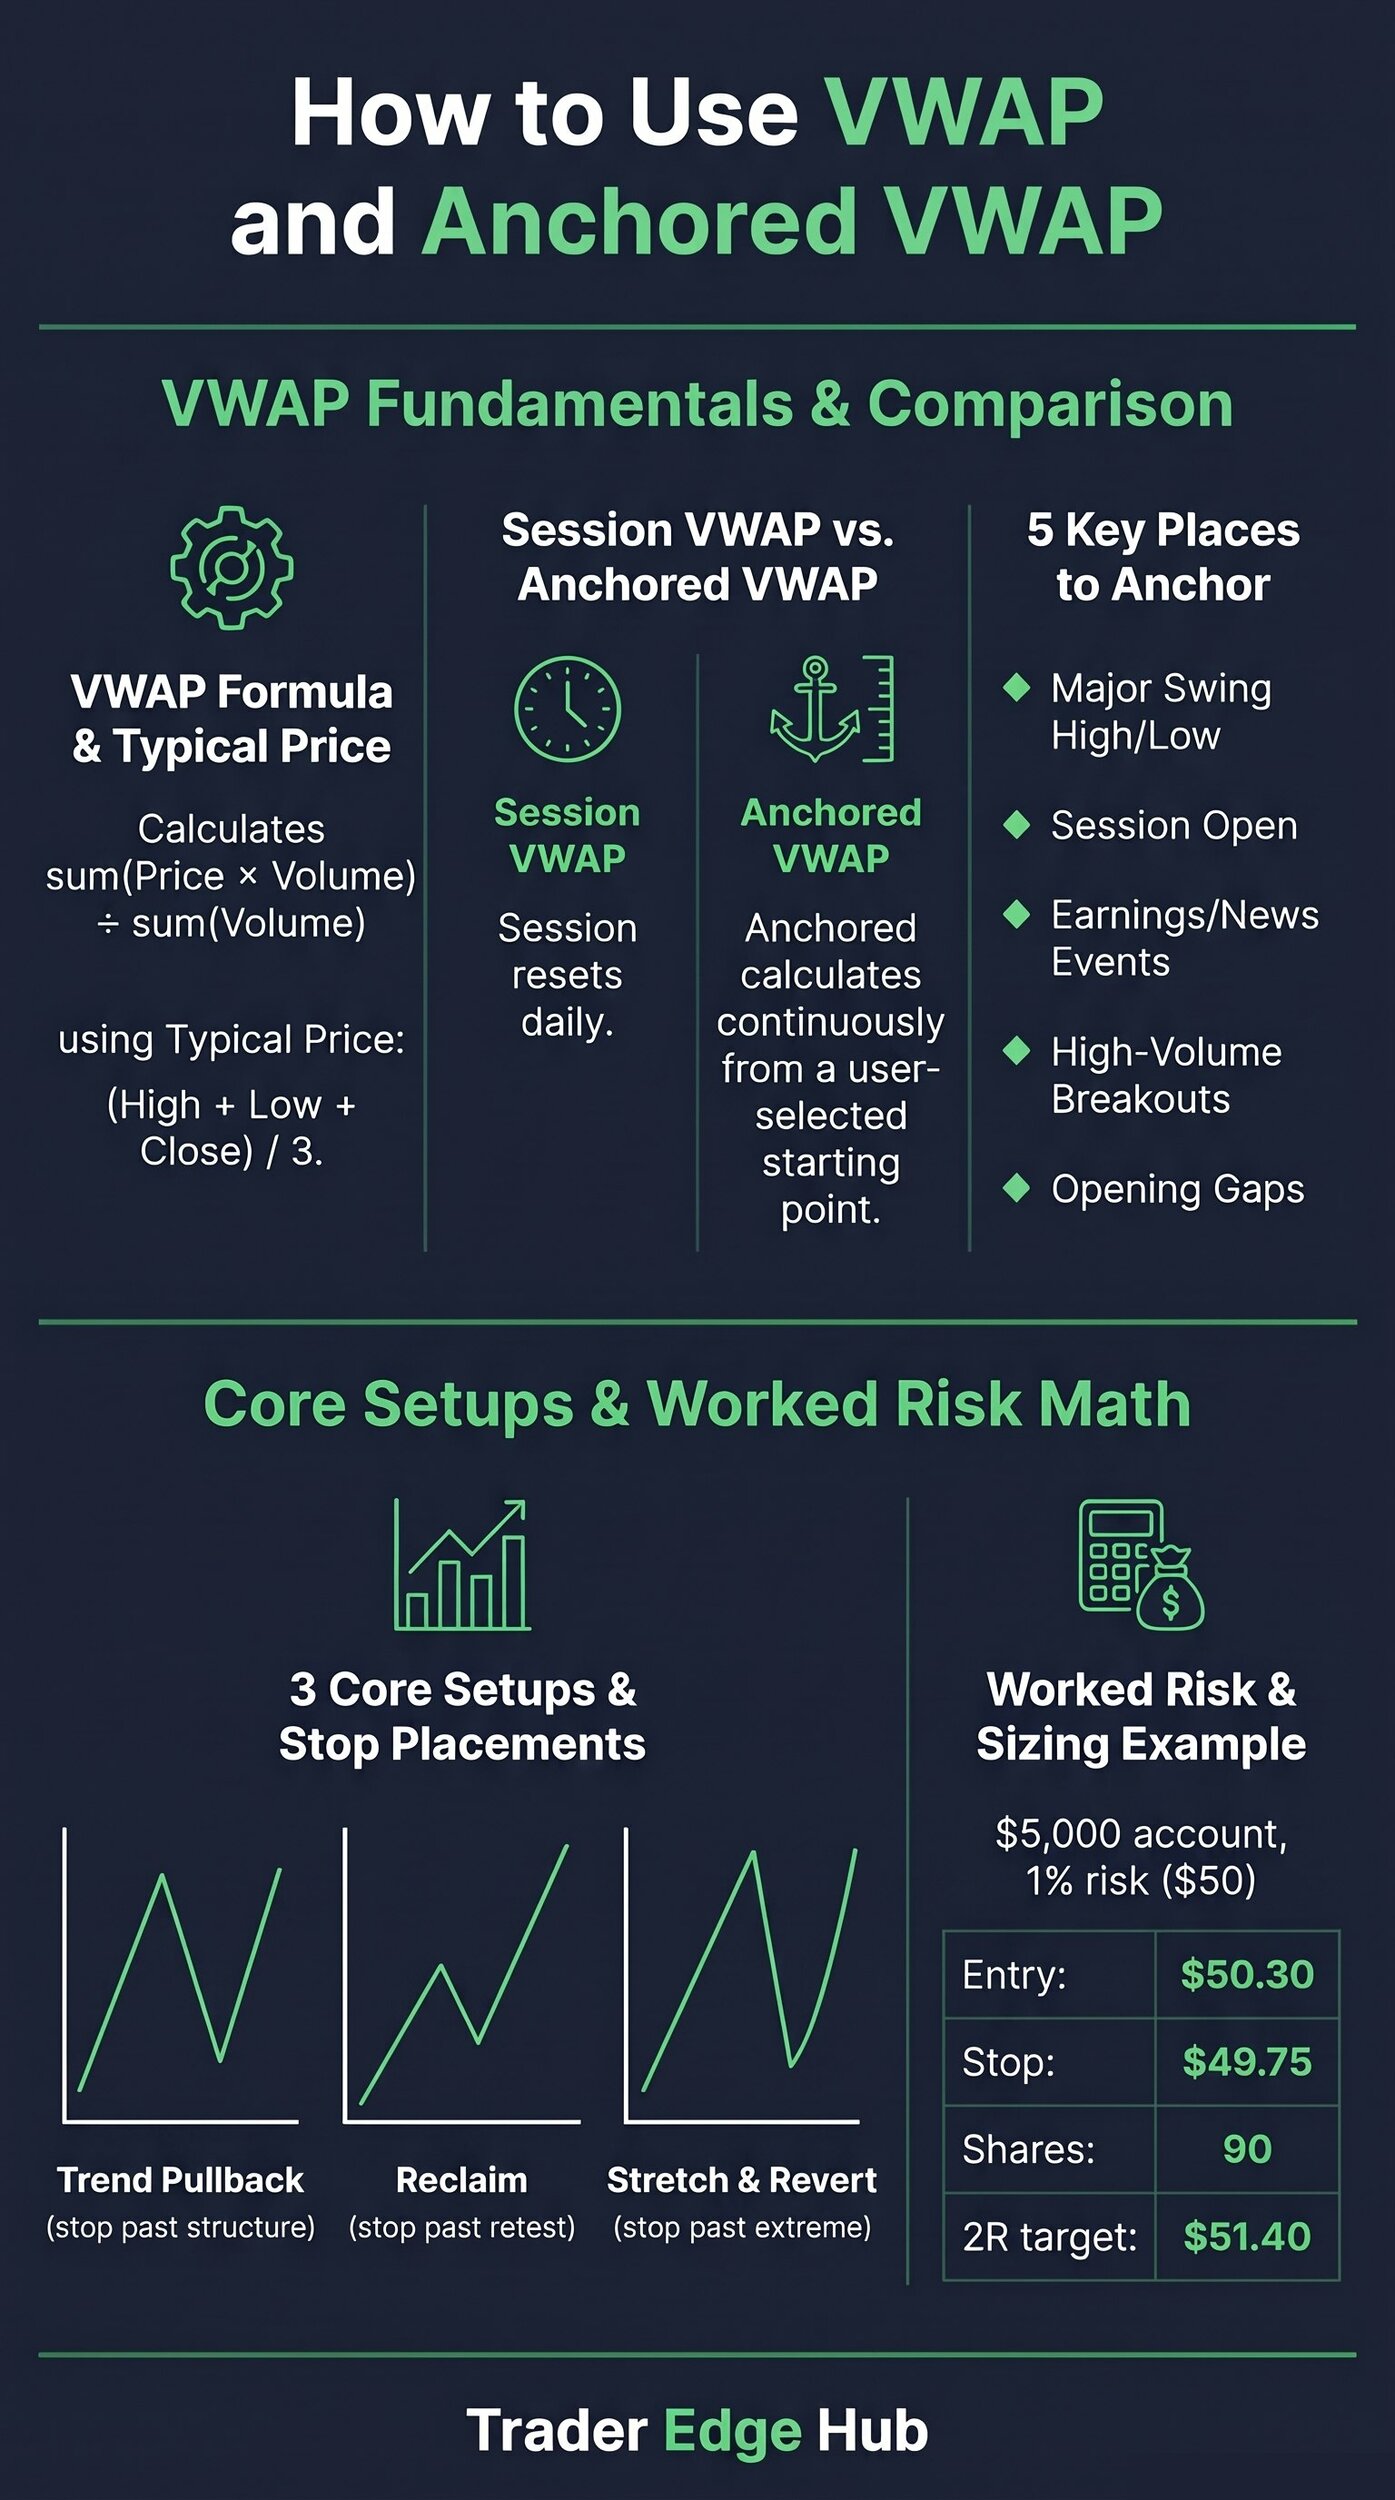
VWAP is the total dollar value traded divided by the total volume. On bar charts, each bar's price is its typical price (HLC3: the average of the bar's high, low and close).
Typical price = (High + Low + Close) ÷ 3
VWAP = Σ(Typical price × Volume) ÷ Σ(Volume)
The five illustrative bars below show how each new bar updates the running totals. The numbers are made up, but the arithmetic is exact.
| Bar | High / Low / Close | Typical price | Volume | Cumulative value | VWAP |
|---|---|---|---|---|---|
| 1 | 102 / 100 / 101 | $101.00 | 100 | $10,100 | $101.00 |
| 2 | 105 / 101 / 103 | $103.00 | 200 | $30,700 | $102.33 |
| 3 | 104 / 102 / 103 | $103.00 | 150 | $46,150 | $102.56 |
| 4 | 108 / 104 / 106 | $106.00 | 300 | $77,950 | $103.93 |
| 5 | 107 / 103 / 105 | $105.00 | 250 | $104,200 | $104.20 |
Take bar 2: its typical price is (105 + 101 + 103) ÷ 3 = $103.00, worth $20,600 over 200 shares. The running value is $10,100 + $20,600 = $30,700 over 300 shares, so VWAP is $102.33. By bar 5 the totals reach $104,200 over 1,000 shares, a VWAP of $104.20. Notice how the heavy bar 4 (300 shares) pulls the line up far more than bar 1 (100 shares) holds it down.
Common mistake: Trusting VWAP in the first few minutes of the session. With one or two bars in the totals, the line jumps around and means little. Give it 15–30 minutes before treating it as a reference.
What is the difference between session VWAP and anchored VWAP?
Both use identical volume-weighting maths; only the starting point differs. Session VWAP resets its totals at the start of each session, such as the 9:30 a.m. Eastern open for US stocks. Anchored VWAP starts from any bar you choose and keeps accumulating, across days, weeks or months, with no calendar reset.
Standard VWAP has a long history as a benchmark. According to the sources we reviewed, it was formalised in a 1988 academic paper by Berkowitz, Logue and Noser, after the first VWAP-benchmarked institutional trade in 1984. Anchored VWAP came later. TradingView's help centre credits the late physicist and analyst Paul Levine with developing it between 1995 and 1997, as part of his MIDAS (Market Interpretation/Data Analysis System) work, building on trader Kevin Haggerty's use of volume-weighted price curves.
Trader Brian Shannon, CMT, author of Maximum Trading Gains with the Anchored VWAP, has done the most to bring it to retail traders. Together with Zach Hurwitz and the CMT Association, he pushed charting platforms to add it, and it is now standard on most of them.
Where should you anchor it?
Choosing the anchor is the most important decision with AVWAP. Random anchors produce random lines. Anchor where ownership of the stock changed hands in a meaningful way:
- Major swing highs and lows. An AVWAP from a major low shows the average cost of buyers since the turn; one from a major high tracks the sellers.
- High-impact economic releases. Anchoring to the bar of a Federal Reserve (FOMC) decision shows the average price paid since the news.
- Earnings reports. The first bar after earnings often carries a volume spike and a gap; anchoring there measures post-earnings conviction.
- Gaps and breakout bars. Anchor to the gap or breakout candle to see whether breakout buyers defend their entries on pullbacks.
- Calendar starts. Year-to-date, month-to-date, week-to-date or an IPO date give the big-picture average cost.
If you cannot say in one sentence why a bar mattered, it is not a good anchor.
How do you add VWAP and anchored VWAP on TradingView?
TradingView offers a manual drawing tool for custom anchors and an indicator that anchors automatically. To place a manual anchor:
- Open a chart and find the drawing toolbar on the left.
- Select the Anchored VWAP tool.
- Click the bar you want to anchor to, such as an earnings gap or a swing low.
- Double-click the line to change its colour, thickness and bands.
For the automatic version, open Indicators, search "VWAP Auto Anchored" and add it. According to TradingView's help centre, its anchor options include:
- Auto: session on intraday charts, month on the daily chart, quarter from 2D to 10D, year from 11D to 60D, and decade above that.
- Highest high, lowest low or highest volume within a lookback length you set, for example the last 100 bars.
- Fixed periods: the start of the last session, week, month, quarter, year, decade or century.
- Corporate events: the last earnings, dividend or split.
The source defaults to HLC3, with HL2 (high plus low, divided by two) as a common alternative. The indicator also plots up to three upper and lower bands, which you can set by standard deviation or by percentage, with a multiplier and an optional shaded fill.
What are the three VWAP setups traders study?
Traders study three main VWAP patterns: the trend pullback, the VWAP reclaim and the stretch-and-revert fade from the bands (envelopes plotted at statistical distances from VWAP). These are historical patterns to study, not signals; past results do not guarantee future ones.
| Setup | What you see | Where the stop goes | When it fails |
|---|---|---|---|
| Trend pullback | Price pulls back to a rising VWAP in an uptrend | Below the local swing low or structural support | Price closes below VWAP and cannot reclaim it |
| VWAP reclaim | Price drops below VWAP, consolidates, then pushes back above on volume | Below the consolidation low | Price falls straight back below VWAP |
| Stretch and revert | Price reaches the second band and stalls | Beyond the extreme of the rejection bar | Volume keeps expanding and price rides outside the bands |
How does the trend pullback work?
In an uptrend, price trades above a rising VWAP. When it dips back to the line, buyers who use VWAP as fair value often step in. You look for the dip to stall near the line, ideally with a bar that rejects lower prices, and you place the stop below the swing low rather than on the line itself.
How does the VWAP reclaim work?
Price sells off below VWAP early, then the selling fades and buyers push it back above the line on rising volume. That shift puts the average intraday buyer back in profit. Traders want a firm close above VWAP and a stop below the low of the consolidation that came before the reclaim.
How does the stretch-and-revert fade work?
This is a mean-reversion trade (betting price returns towards its average) at a statistical extreme. When price reaches the second band and momentum slows, traders look for a rejection bar and aim back towards VWAP, not for a full reversal. It is the hardest of the three, because on strong trend days price can ride the band for hours.
When VWAP goes flat and price crosses it back and forth, the market is in a chop regime (sideways trading with little conviction). That is the time to stand aside and protect your capital.
How does a VWAP trade look with real numbers?
Here is an illustrative trend-pullback trade with a $5,000 account and the 1% risk rule, so a $50 maximum loss.
| Step | Value |
|---|---|
| Session VWAP | $50.24 |
| Entry as buyers reject lower prices | $50.30 |
| Stop, below the session low of $49.80 | $49.75 |
| Risk per share | $0.55 |
| Position size | $50 ÷ $0.55 = 90 shares (90.9 rounded down) |
| Capital used | 90 × $50.30 = $4,527 |
| Actual risk | 90 × $0.55 = $49.50 |
| 2R target | $50.30 + $1.10 = $51.40, a $99 gain |
The stop sits below market structure, not on VWAP, because price often pierces an average before turning. Our stop-loss guide covers structure and ATR stops in more detail. The position also fits the account without margin: 90 shares use $4,527 of $5,000. If a tighter stop asked for more shares than you can hold, take fewer or skip the trade.
Decide in advance what proves the trade wrong before the stop is hit. One simple rule we use: if a 5-minute bar closes below VWAP and the next bar fails to reclaim it, exit early. A 2R target only pays if your win rate supports it, which our guide to trading expectancy shows how to check.
An anchored VWAP swing example
The same maths works over several days. Say a stock reports earnings and gaps up, and you anchor VWAP to that bar; two weeks later the AVWAP sits at $84.20. You enter at $85.00 as price holds above the line, with a stop at $82.90 below structure. That is $2.10 of risk per share, so $50 ÷ $2.10 gives 23 shares (23.8 rounded down), using $1,955 of capital and risking $48.30.
What are the most common VWAP mistakes?
- Using session VWAP on daily charts. Session VWAP is built for intraday bars. For multi-day views use anchored VWAP, or the Auto Anchored indicator, which switches to a monthly anchor on the daily chart.
- Chasing price far above VWAP. Buying a stretched move worsens your risk-reward; wait for a pullback towards the line.
- Picking anchors with hindsight. Choosing the anchor after you have seen the bounce makes any chart look perfect. Set your anchor rules first.
- Ignoring volume. A low-volume touch of VWAP means far less than a high-volume rejection.
- Placing stops right on the line. Normal noise will hit them. Put stops behind a structural pivot.
- Trading a flat VWAP. Repeated crosses of a flat line are chop. Stand aside until the slope returns, and set a daily trade limit; our overtrading guide shows how.
Pro tip: Combine session VWAP with an anchored VWAP from a recent major event. When a rising session VWAP lines up with a key AVWAP, that zone deserves more attention than either line alone.
Should you use VWAP with volume profile?
Yes, because they answer different questions. VWAP gives a moving average price over time, while volume profile shows fixed horizontal levels where heavy trading happened. When VWAP sits close to the profile's point of control (POC, the price with the most volume) or a high-volume node, many traders treat that area as fair value. Low-volume nodes are price zones that tend to be crossed quickly, often towards VWAP.
Which tools help you trade with VWAP?
TradingView covers everything in this guide, and you can start on the free plan:
- Session VWAP indicator from the Indicators menu for intraday levels.
- Anchored VWAP drawing tool in the left toolbar for manual anchors.
- VWAP Auto Anchored indicator for anchors to highs, lows, periods and earnings.
- Bar Replay to step through past sessions bar by bar and practise spotting the three setups without risking money (check which timeframes your plan can replay).
Upgrade only when you hit a specific limit, such as the number of indicators per chart. If you want to see what its newer AI features can and cannot do, read our TradingView AI review, and log every setup you take in a trading journal.
Common mistake: Treating VWAP as a standalone buy or sell signal. Wait for agreement from market structure, a rejection bar or a volume profile level before you act.
Test yourself: a 5-question VWAP quiz
Check what stuck before you open a chart. The answers are below each question.
1. How is typical price calculated in standard VWAP calculations?
A) (High + Low) ÷ 2
B) (High + Low + Close) ÷ 3
C) (Open + High + Low + Close) ÷ 4
D) (High + Close) ÷ 2
Answer: B. Typical price (HLC3) is the average of a bar's high, low and close.
2. What is the main difference between session VWAP and anchored VWAP?
A) Session VWAP has bands and anchored VWAP does not
B) Session VWAP resets each session; anchored VWAP runs from a bar you choose
C) Session VWAP ignores volume
D) Session VWAP only works on daily charts
Answer: B. Both use the same volume-weighted maths; only the starting point differs.
3. Which is a sound anchor point for anchored VWAP?
A) A random bar in a quiet session
B) A bar picked after you saw where price bounced
C) A major event such as an earnings report or a big swing high or low
D) Any bar that makes VWAP line up with a moving average
Answer: C. Good anchors are events where ownership of the stock shifted.
4. On a trend pullback to VWAP, where does the stop belong?
A) Exactly on the VWAP line
B) Five ticks below entry, whatever the chart shows
C) Behind structural support or the swing low
D) At yesterday's closing price
Answer: C. Stops behind structure survive the normal noise around an average.
5. What does a flat VWAP that price keeps crossing tell you?
A) A strong trend is starting
B) A choppy, range-bound market with no clear control
C) A confirmed breakout
D) Large sellers are liquidating
Answer: B. Repeated crosses of a flat line mean neither side is in control, so standing aside is reasonable.
FAQ
Does VWAP work on all chart timeframes?
Session VWAP needs intraday charts, such as 1-minute or 5-minute bars, because it resets every session. For daily, weekly or multi-month trends, use anchored VWAP.
What is the difference between VWAP and a simple moving average?
An SMA averages closing prices equally over a fixed number of bars. VWAP weights each bar by volume and accumulates from its starting point, so it reflects where most of the trading happened.
Does VWAP predict future price movement?
No. VWAP describes trades that already happened. It tells you where price sits relative to the average cost, not where it will go.
Why do large trading desks care about VWAP?
Big orders can move the market against the buyer. Filling near or better than VWAP keeps those costs down, so managers grade brokers by comparing average fills with the day's VWAP.
What settings should you use for VWAP bands?
Many traders use multipliers of 1 and 2 standard deviations. The first band covers normal variation; the second marks stretched territory. Adjust them to the volatility of what you trade.
Can you use VWAP for swing trading?
Yes. Anchored VWAP from an earnings release, a high-volume gap or a major swing low tracks the average cost of buyers over days or weeks.
The verdict
VWAP and anchored VWAP combine price, time and volume into one line, which makes them some of the most informative tools on a chart. They do not predict anything, so pair them with structural stops, a fixed 1% risk and a clear rule for when you are wrong. Your next step: open TradingView, put an anchored VWAP on a recent earnings gap, and replay how price behaved on the pullbacks before you place a single trade.
Sources: TradingView Help Center (VWAP Auto Anchored; Anchored VWAP drawing tool), AlphaTrends (Brian Shannon), thinkorswim Learning Center, TrendSpider and other sources in our Technical Analysis research notebook. Examples are illustrative; past results do not guarantee future ones.
Trading involves substantial risk of loss, and most retail traders lose money. This article is education, not financial advice.
Further reading: For a broad reference on chart reading, trends, volume and indicators, John Murphy's Technical Analysis of the Financial Markets is a long-standing standard text. Check the current price on Amazon.
As an Amazon Associate, Trader Edge Hub earns from qualifying purchases.