
- What is trading expectancy?
- The expectancy formula, step by step
- Expectancy in R-multiples vs dollars
- What does a good expectancy look like?
- What if your expectancy is negative?
- How do you calculate expectancy from your own trades?
- Three ways to improve expectancy
- Expectancy vs profit factor vs SQN
- Common expectancy mistakes
- FAQ
- Is positive expectancy enough?
- How many trades do I need?
- Can expectancy change?
- Does expectancy include fees?
- The verdict
Trading involves substantial risk of loss. This article is education, not financial advice.
Disclosure: this article contains affiliate links. If you sign up through them, Trader Edge Hub may earn a commission at no extra cost to you. We only mention tools we think fit the topic.
Most traders spend years chasing a better win rate or a flashier setup, and still lose money, because they never check whether the whole strategy has an edge. A high win rate feels great. It can also hide losses big enough to quietly erase every gain. This guide shows you the trading expectancy formula, which combines your win rate, loss rate, average win and average loss into one number. By the end you will be able to calculate your own expectancy, judge a setup in dollars and in R, and cut a losing strategy before it drains your account.
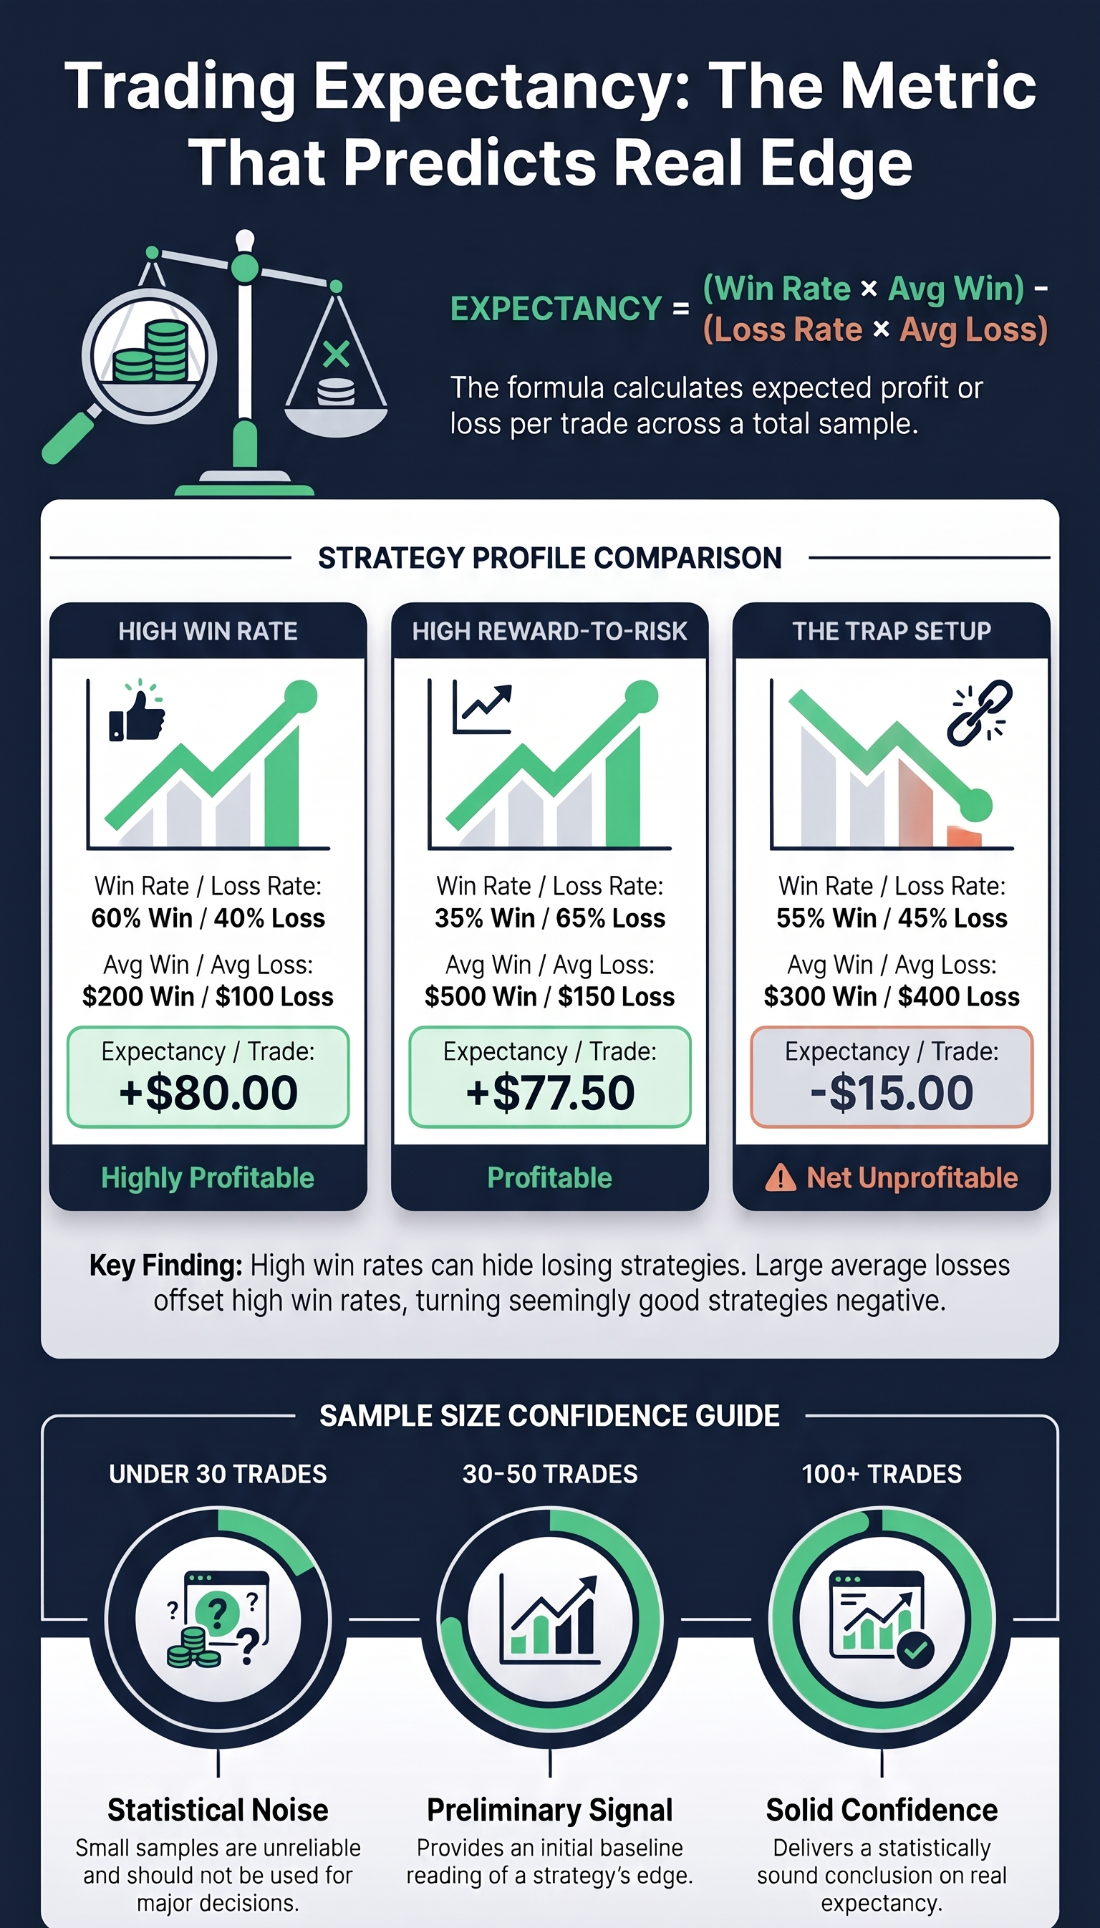
Quick answer: Trading expectancy is the average amount you make or lose per trade across a large sample. The formula is: Expectancy = (Win rate × Average win) − (Loss rate × Average loss). A result above zero after costs means the strategy has an edge. A result below zero means it loses money over time.
What is trading expectancy?
Trading expectancy (the average profit or loss a strategy produces per trade over many trades) is one of the best single checks on whether a strategy works. Many traders fixate on win rate (the percentage of trades that make money). On its own, win rate misleads. A strategy can win 90% of the time and still lose money if its rare losses are huge.
Expectancy fixes that by blending winners and losers into one average. Positive expectancy (average gains beat average losses) means that over enough trades the strategy makes money. Negative expectancy (average losses beat average gains) means it loses money on average, however good a few winning streaks feel. Market researcher Van Tharp stressed that a profitable system needs a positive expectancy plus sensible position sizing (deciding how much to risk on each trade).
Knowing your expectancy also changes how you react. If your system has a positive average payoff over fifty or a hundred trades, one loss stops feeling like a verdict. You stop asking whether today's trade won and start treating each trade as one data point in a probability game. Mechanical stop losses (orders that exit a trade at a preset price) keep your average loss under control, and that protects the edge.
The expectancy formula, step by step
You need four numbers from your trading journal (a log of your entries, exits and results): win rate, loss rate, average win and average loss. Write win rate and loss rate as decimals, so 50% becomes 0.50. In a two-outcome model the loss rate is 1 minus the win rate. Enter the average loss as a positive number.
Formula: Expectancy = (Win rate × Average win) − (Loss rate × Average loss). In symbols: E = (W × AW) − (L × AL). To include costs (commissions, spreads and slippage), subtract the average cost per trade: Net E = (W × AW) − (L × AL) − C.
Here are three setups with real numbers.
Example 1: high win rate, small winners. A short-term strategy wins 60% of its trades. The average win is $200 and the average loss is $100. Expectancy = (0.60 × $200) − (0.40 × $100) = $120 − $40 = +$80 per trade. Over 100 trades that is about $8,000 before fees.
Example 2: low win rate, big winners. A trend-following strategy wins only 35% of the time, but lets winners run. The average win is $500 and the average loss is capped at $150. Expectancy = (0.35 × $500) − (0.65 × $150) = $175 − $97.50 = +$77.50 per trade. It loses nearly two trades in three and is still clearly profitable.
Example 3: the setup that looks good but loses. A gap-and-go trader wins 55% of trades with an average win of $300. But the trader hesitates to take losses and moves stops wider, so the average loss swells to $400. Expectancy = (0.55 × $300) − (0.45 × $400) = $165 − $180 = −$15 per trade. Winning more than half the time and enjoying great winning days still bleeds the account.
Expectancy in R-multiples vs dollars
Dollar expectancy tells you what the strategy earns on your specific account. It also bakes your position size into the number. Making $50 a trade is great on a $2,000 account, but it looks different if you had to risk $1,000 to make it. To compare strategies fairly across account sizes and markets, traders use R-multiples (a trade's profit or loss divided by the amount you risked at the start).
Your starting risk is 1R. Risk $100 and make $300 and the trade is +3R. Get stopped out and it is −1R. To get expectancy in R, multiply your win rate by your average win in R, then subtract your loss rate times your average loss in R. A result such as +0.40R per trade lets a trader risking $50 compare edges directly with one risking $5,000.
What does a good expectancy look like?
The one fixed rule is that expectancy must be above zero after you subtract all costs. Beyond that, the sources we reviewed offer rough benchmarks, not guarantees. One range puts many profitable retail traders at roughly $25 to $150 per trade. In R terms, profitable strategies often fall between +0.20R and +0.60R per trade, and a sustained result above +0.50R over 100 or more trades is described as excellent. Treat these as reference points, not targets, because they vary by market and style.
Sample size matters just as much. A figure based on fewer than 30 trades is mostly noise. Around 30 to 50 trades you get a preliminary reading, and at 100 or more closed trades the number becomes reasonably solid.
What if your expectancy is negative?
Do not panic and do not abandon your plan after a bad week. First check the sample size and make sure costs are in the numbers. Then look at which input is the problem. Is the win rate too low for the ratio you use? Are your average losses bigger than your planned 1R because you move stops? If so, the fix is discipline, not a new strategy. If the numbers stay negative over 100 trades with honest inputs, trade smaller or paper trade the idea until you have changed it enough to test again.
How do you calculate expectancy from your own trades?
- Log every trade in R. Record your planned risk at the stop as 1R and your net result after fees as a multiple of R.
- Find win rate and loss rate. Divide wins by total trades, and losses by total trades.
- Find average win and average loss. Add up the R of all winners and divide by the number of winners. Do the same for losers, using positive numbers.
- Apply the formula. Multiply win rate by average win, multiply loss rate by average loss, and subtract the second from the first.
Here is a 10-trade journal sample:
| Trade | Result (R) | Outcome |
|---|---|---|
| 1 | +2.0R | Win |
| 2 | −1.0R | Loss |
| 3 | +1.5R | Win |
| 4 | −1.0R | Loss |
| 5 | +3.0R | Win |
| 6 | −1.0R | Loss |
| 7 | +1.0R | Win |
| 8 | −1.0R | Loss |
| 9 | +2.5R | Win |
| 10 | −1.0R | Loss |
The arithmetic: 5 wins out of 10 trades gives a 50% win rate and a 50% loss rate. Average win = (2.0 + 1.5 + 3.0 + 1.0 + 2.5) ÷ 5 = 10.0R ÷ 5 = +2.0R. Average loss = 5 × 1.0R ÷ 5 = 1.0R. Expectancy = (0.50 × 2.0R) − (0.50 × 1.0R) = 1.0R − 0.5R = +0.50R per trade.
You can check it another way. The total of all ten results is +5.0R, and 5.0R divided by 10 trades is +0.50R. This is only an illustration. Ten trades is far too few to trust in real life.
Three ways to improve expectancy
Every change you make hits at least one of three levers. Knowing which one you are pulling stops you from random tweaks that wreck your edge.
- Raise your average win. Hold winners longer, use trailing stops (stops that move with price as a trade works) or target major resistance. The catch: bigger targets are hit less often. If a target sits too far away, price turns before it gets there and winners become stop-outs.
- Cut your average loss. Use mechanical stops and exit losers promptly. The catch: a stop squeezed inside normal price noise gets hit by routine wiggles and spreads (the gap between buy and sell price), which drags your win rate down.
- Raise your win rate. Take higher-quality setups and skip choppy, range-bound markets. The catch: chasing a higher win rate by grabbing profits early shrinks your average win. If your win rate rises from 50% to 60% but your average win falls from 2R to 0.5R, expectancy gets worse.
Expectancy vs profit factor vs SQN
Expectancy has two well-known cousins. Each answers a different question.
| Metric | What it tells you | How the sources describe it |
|---|---|---|
| Expectancy | What an average trade earns | Above zero after costs means an edge; +0.20R to +0.60R is described as high quality |
| Profit factor | Total gross profit divided by total gross loss | Below 1.0 loses money, above 1.0 is profitable, and 1.5 to 2.0 is described as strong |
| System Quality Number (SQN) | How smooth and consistent results are | Developed by Van Tharp; one scale rates below 1.5 as poor, 2.0 to 2.5 as average, 2.5 to 2.9 as good and 3.0 or more as excellent |
Profit factor looks at the whole sample. It is gross winning dollars divided by gross losing dollars. SQN divides expectancy by the standard deviation (the spread) of your R-multiples and scales it by the square root of your trade count, capped at 100 trades. A high SQN means your returns are steady, which makes it safer to size up. Scales differ between sources, so use them to compare your own systems, not to chase a score.
Common expectancy mistakes
The classic mistake is loving a high win rate while ignoring the rare, enormous loss that wipes out weeks of gains. A second is ignoring friction. The textbook formula assumes zero costs, but live trading has commissions, spreads and slippage (the difference between the price you expected and the price you got). Costs shrink your average win and enlarge your average loss, and that can turn a positive expectancy on paper into a loser in practice.
Common mistake: Judging a strategy on fewer than 30 trades, or forgetting to subtract costs. A small sample is mostly noise, and ignoring fees can flip a positive expectancy to negative.
Pro tip: Build a 50 to 100 trade sample before you make a big decision. Early trends show around 30 to 50 trades, but you want at least 100 closed trades before you trust the number.
If you want to set the inputs well, our guides on position sizing and the 1% rule and the risk-reward ratio cover the risk side of the formula.
FAQ
Is positive expectancy enough?
No. It shows you have an edge, not that your account will survive. You still need position sizing and risk control to avoid deep drawdowns and the risk of ruin (the chance a losing run empties the account).
How many trades do I need?
At least 30 for a first look, around 50 for a more reliable estimate, and 100 or more for a number you can lean on. Changing a strategy on fewer than 30 trades means reacting to noise.
Can expectancy change?
Yes. It can swing between trending and choppy markets, and markets evolve. Edge decay (the slow fading of a strategy's profits as conditions change) is real, so recheck your numbers regularly.
Does expectancy include fees?
Not unless you subtract them. For a true net figure, deduct round-trip commissions, spreads and average slippage from your results.
The verdict
Expectancy separates a genuine edge from luck. Track your win rate, loss rate, average win and average loss in R, subtract your costs, and be patient until you have a real sample. Your next step: open your trading journal, pull your last 50 closed trades, and calculate your net expectancy today.
Trading involves substantial risk of loss. This article is education, not financial advice.
Further reading: Van Tharp's Trade Your Way to Financial Freedom helped popularise expectancy and R-multiples among retail traders, and walks through how to measure a system the same way this article does. Check the current price on Amazon.
As an Amazon Associate, Trader Edge Hub earns from qualifying purchases.