

- What is the risk-reward ratio?
- How do you calculate it?
- Why win rate and risk-reward must be judged together
- How do you set a realistic target?
- What minimum ratio should a beginner use?
- Common risk-reward mistakes
- FAQ
- What is a good risk-reward ratio?
- Is 1:1 enough?
- Can I win with a 30% win rate?
- Does the ratio include fees?
- The verdict
Trading involves substantial risk of loss. This article is education, not financial advice.
Disclosure: this article contains affiliate links. If you sign up through them, Trader Edge Hub may earn a commission at no extra cost to you. We only mention tools we think fit the topic.
Most beginners hear that a good trade needs a 1:3 risk-reward ratio, so they push their profit targets far away and wait. Then trade after trade turns around short of the target and hits the stop. The ratio looked great on the chart, and the account still shrank. This guide shows you how the ratio really works, how to calculate it, and how to judge it together with your win rate so you can pick setups that actually pay.
Quick answer: The risk-reward ratio compares what you stand to lose (entry to stop) with what you stand to gain (entry to target). A 1:1 ratio can be very profitable if you win often enough. A 1:3 ratio fails if the target is so far away that price rarely reaches it. Judge the ratio and your win rate together.
What is the risk-reward ratio?
The risk-reward ratio (a comparison of what you could lose on a trade with what you could gain) tells you whether a setup is worth taking before you place the order. It compares the distance from your entry to your stop loss (a pre-set order that closes the trade at a chosen price to cap the loss) with the distance from your entry to your profit target (the price where you plan to take your gain).
Traders write the ratio two ways, with risk first or with reward first. This guide writes risk first. A 1:2 ratio means you risk one dollar to try to make two. If you risk $100 to make $200, that is 1:2, which some people write as 2:1 reward to risk. Pick one convention and stick to it so you do not mix up numbers from different sources.
One trap catches beginners early. A bigger planned ratio does not make a trade safer. Moving the target further away on the chart does nothing for you if the market rarely gets there. Your target needs to sit at a believable level, such as just below the nearest resistance (a price area where sellers have repeatedly pushed price back down). Otherwise the ratio is a number on a screen and nothing more.
Author Van Tharp suggested measuring results in R (your planned risk on one trade, in dollars or percent). A trade that hits your stop is -1R. A trade that reaches a 1:2 target is +2R. Thinking in R-multiples (profit or loss as a multiple of your planned risk) lets you compare trades across stocks, forex and futures, and across accounts of any size. It also takes some of the emotion out of single trades.
How do you calculate it?
You need three prices before you enter: your entry, your stop and your target. For a long trade, risk per share is entry minus stop. Reward per share is target minus entry. Divide reward by risk to get your reward multiple.
| Step | Formula |
|---|---|
| Risk per share | Entry price minus stop price |
| Reward per share | Target price minus entry price |
| Reward multiple | Reward per share divided by risk per share |
Here is a worked example. You plan to buy a stock at $50.00. Support on the chart sits at $49.00, so you place your stop there. Your risk is $1.00 per share. The next resistance is at $52.00, so your target is there. Your reward is $2.00 per share. Divide $2.00 by $1.00 and you get a reward multiple of 2, which is a 1:2 ratio.
The ratio is the same whether you buy 50 shares or 500. Position size decides how many dollars you put at risk, and the ratio decides whether the setup deserves the risk at all. If you want to see it drawn on a chart, TradingView has a long and short position tool that shows the risk and reward zones before you place the order. It is one option, and it has a free plan.
If you are not sure how many shares to buy, start with our guide to position sizing and the 1% rule. The two work as a pair: the ratio tells you whether to take the trade, and sizing tells you how big to make it.
Why win rate and risk-reward must be judged together
Many beginners think a high win rate (the share of your trades that make money) is all that matters. It is not. A system that wins 70% of the time but makes $50 on its winners and loses $200 on its losers will drain your account. Win rate and ratio only mean something together, because together they give you expectancy (the average amount you make or lose per trade over many trades).
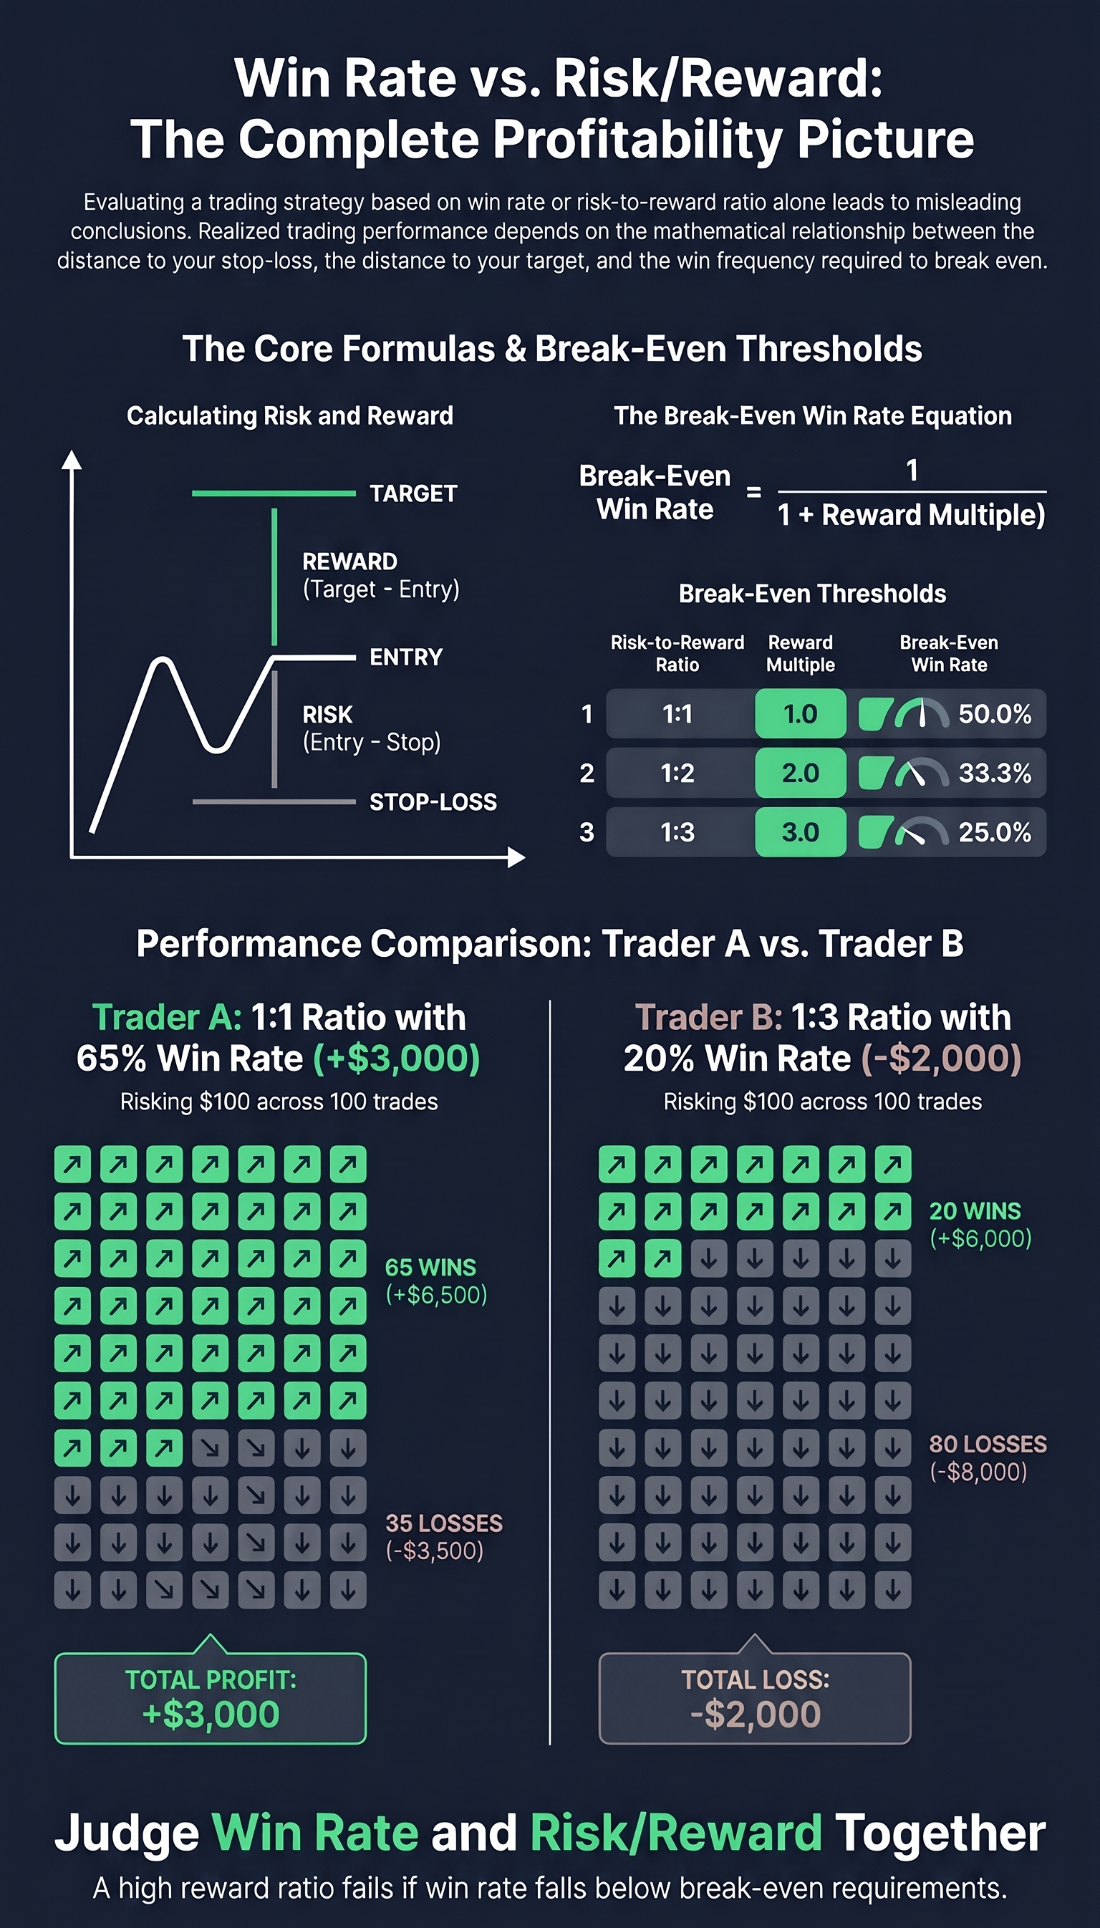
Every ratio has a break-even win rate, the share of trades you must win just to cover your losses before costs. The formula is 1 divided by (1 plus the reward multiple).
| Planned ratio | Reward multiple | Math | Break-even win rate (no costs) |
|---|---|---|---|
| 1:1 | 1 | 1 ÷ (1 + 1) = 1 ÷ 2 | 50.0% |
| 1:2 | 2 | 1 ÷ (1 + 2) = 1 ÷ 3 | 33.3% |
| 1:3 | 3 | 1 ÷ (1 + 3) = 1 ÷ 4 | 25.0% |
| 1:4 | 4 | 1 ÷ (1 + 4) = 1 ÷ 5 | 20.0% |
A bigger reward multiple lowers the win rate you need. At 1:1 you must win half your trades. At 1:3 you only need to win one in four. So why not demand 1:3 or 1:4 every time? Because a target three or four times further away than your stop gets hit far less often. If you push a target past real resistance just to make the ratio look better, price tends to stall and turn around, and your actual win rate falls below the bar.
Costs make the bar higher. Spreads (the gap between the buy and sell price), commissions and slippage (getting a worse price than you expected) all take a bite. As an illustration, if costs take about 0.06R per trade, the break-even rate at 1:1 rises from 50% to about 53%, and at 1:3 from 25% to about 26.6%. Your own costs will differ by broker and market, so measure them.
Now compare two traders over 100 trades, each risking $100 per trade.
| Trader A | Trader B | |
|---|---|---|
| Planned ratio | 1:1 | 1:3 |
| Target placement | Close, at believable levels | Far, beyond real resistance |
| Win rate | 65% (65 wins, 35 losses) | 20% (20 wins, 80 losses) |
| Wins | 65 × $100 = $6,500 | 20 × $300 = $6,000 |
| Losses | 35 × $100 = $3,500 | 80 × $100 = $8,000 |
| Net result | +$3,000 (+0.30R per trade) | -$2,000 (-0.20R per trade) |
Trader A beats the 50% bar at 1:1 with room to spare. Trader B needs 25% at 1:3 and only gets 20%, so the bigger target turns a promising plan into a losing one. The numbers are illustrative, but the lesson holds: the best ratio is the one your win rate can clear.
How do you set a realistic target?
Anchor the target to the chart, not to the ratio you want. For a long trade, set it just below the nearest resistance. A New York Fed study of currency markets reported that published support and resistance levels tended to halt intraday trends more often than chance would suggest, so these zones are worth respecting. If resistance sits forty cents above your entry, a two-dollar target is wishful thinking.
Work in this order. First, place the stop at a logical level based on market structure. Second, find the next major boundary for the target. Third, calculate the ratio. If the result is poor, do not stretch the target or squeeze the stop. Skip the trade, or wait for a pullback that gets you a closer entry.
Remember how targets are filled. A profit target is usually a limit order (an order to buy or sell at a set price or better). If price stalls one penny short of resistance, an order placed exactly on resistance never fills. Placing the target slightly below the level helps it fill when price gets close.
Finally, write each target in R. A target at 2R against a 1R stop gives you a simple, consistent way to judge whether the structure on the chart justifies the risk, whether you trade stocks, forex or futures.
What minimum ratio should a beginner use?
There is no magic number. A common starting filter is a planned ratio of at least 1:1.5 or 1:2 while you build discipline. At 1:1.5 the break-even win rate is 40% (1 ÷ 2.5) before costs, which a well-chosen setup can realistically beat. At 1:3 it falls to 25%, but you need a major level far above your entry, and those are rarer.
Your own record should decide. If your journal shows a 60% to 65% win rate, a 1:1 or 1:1.2 plan can grow an account. If your win rate is lower, you need larger average wins to stay positive. Use a minimum such as 1:1.5 as a first filter, then compare the planned ratio of each setup with your real win rate. If it does not clear your break-even bar, walk away and wait.
Common risk-reward mistakes
The biggest mistake is adjusting prices on paper to hit a target ratio. Moving a target above resistance, or squeezing a stop inside a normal swing, lowers the odds of the trade. Price hits the tight stop or reverses before the stretched target, and a manageable trade turns into an avoidable loss.
The second is confusing the planned ratio with what you actually get. A 1:3 target on the screen means little if you close winners early at 1:1 or price often turns before it gets there. Your realized ratio is the one that pays you.
The third is ignoring costs. Spreads, commissions and slippage shrink your wins and enlarge your losses. And a big ratio cannot rescue a strategy with no edge. If price moves randomly, a distant target is hit less often in proportion to its distance, so the extra payout is cancelled out by fewer wins and you are left paying the costs.
Common mistake: Pushing your target above real resistance, or tightening your stop, just to show a 1:2 or 1:3 ratio on paper. It lowers the odds of the trade and turns planned winners into losers.
Pro tip: Do not trust planned ratios alone. Log every trade in a journal and track your realized average win and average loss in R over at least 50 closed trades. Compare that with your true win rate to see your real expectancy after costs.
FAQ
What is a good risk-reward ratio?
There is no single good ratio. It depends on your win rate and costs. A 1:1 or 1:1.5 ratio works for strategies that win often. Lower win-rate systems need 1:2 or 1:3, as long as the chart supports those targets.
Is 1:1 enough?
Yes, if your win rate beats the break-even level. At 1:1 that is 50% before costs, and a little over 53% with the example costs above. A 60% to 65% win rate at 1:1 produces steady growth.
Can I win with a 30% win rate?
Yes, if your average winner is large enough. At 1:3 the break-even rate is 25% before costs and about 26.6% with the example costs, so 30% clears the bar. That only works if your targets actually get hit at that rate.
Does the ratio include fees?
No. The ratio you draw on a chart measures price distance only. Spreads, commissions and slippage reduce your wins and enlarge your losses, which raises the win rate you need.
The verdict
The risk-reward ratio is not a score to maximize. It is one half of a pair, and your win rate is the other half. Set targets at believable levels, work out the break-even win rate for each setup, and check it against your own results. Your next step: open your chart, mark the nearest support and resistance on the stocks you watch, and calculate the break-even win rate before your next order.
Sources: LuxAlgo, DayTradingToolkit, FinFeed API and Standard Bank trader community explainers on risk-reward and win rate; Van Tharp on R-multiples. Break-even figures are calculated from the formula above.
Trading involves substantial risk of loss. This article is education, not financial advice.
Further reading: If you want to go deeper on judging trades by risk rather than by win rate, Van Tharp's Trade Your Way to Financial Freedom explains R-multiples and why risk-reward only makes sense alongside how often you win. Check the current price on Amazon.
As an Amazon Associate, Trader Edge Hub earns from qualifying purchases.