
- What is a stop loss, and why does placement matter?
- Structure stops: put the stop where the idea fails
- ATR stops: let volatility set the distance
- Worked example with a $10,000 account
- Time stops: get out of dead trades
- Comparing the five stop types
- Trailing stops vs fixed stops
- Hard stops vs mental stops
- Gaps and slippage: a stop is not a guaranteed price
- Common stop loss mistakes
- How to choose your stop method
- A five-step checklist before every trade
- FAQ
- What is the best stop loss strategy for beginners?
- How do I know if my stop is too tight?
- Should I use a different ATR multiplier for day trading and swing trading?
- Is a stop loss guaranteed to fill at my price?
- The verdict
Trading involves substantial risk of loss. This article is education, not financial advice.
Disclosure: this article contains affiliate links. If you sign up through them, Trader Edge Hub may earn a commission at no extra cost to you. We only mention tools we think fit the topic.
Most beginners spend weeks studying entries and about thirty seconds deciding where to put the stop loss. That is backwards. The stop decides how much you lose when you are wrong, how often you get shaken out of good trades, and how many shares you are allowed to buy. This guide shows you the main ways to place a stop (structure, ATR and time), walks through a worked example with real numbers, and points out the mistakes that quietly drain accounts.
Quick answer: Place your stop where your trade idea is proven wrong, not at a random dollar amount. Use a structure stop beyond a key support or resistance level, an ATR stop that adapts to volatility, or a time stop that closes a trade going nowhere. Then size your position from the stop distance, never the other way around.
What is a stop loss, and why does placement matter?
A stop loss (a pre-set order that automatically closes a trade at a specific price to limit your loss) is the one tool that caps the damage from a wrong trade. Having a stop is the easy part. Placing it well is the skill. Put it too close and ordinary price wiggles knock you out before the trade has a chance. Put it too far and one loss takes a big bite out of the account.
The sources we reviewed make the same point from different angles: stop placement shapes your win rate, your average loss and your overall profitability. Entries get the attention, but the stop is where most of the risk is actually decided.
Structure stops: put the stop where the idea fails
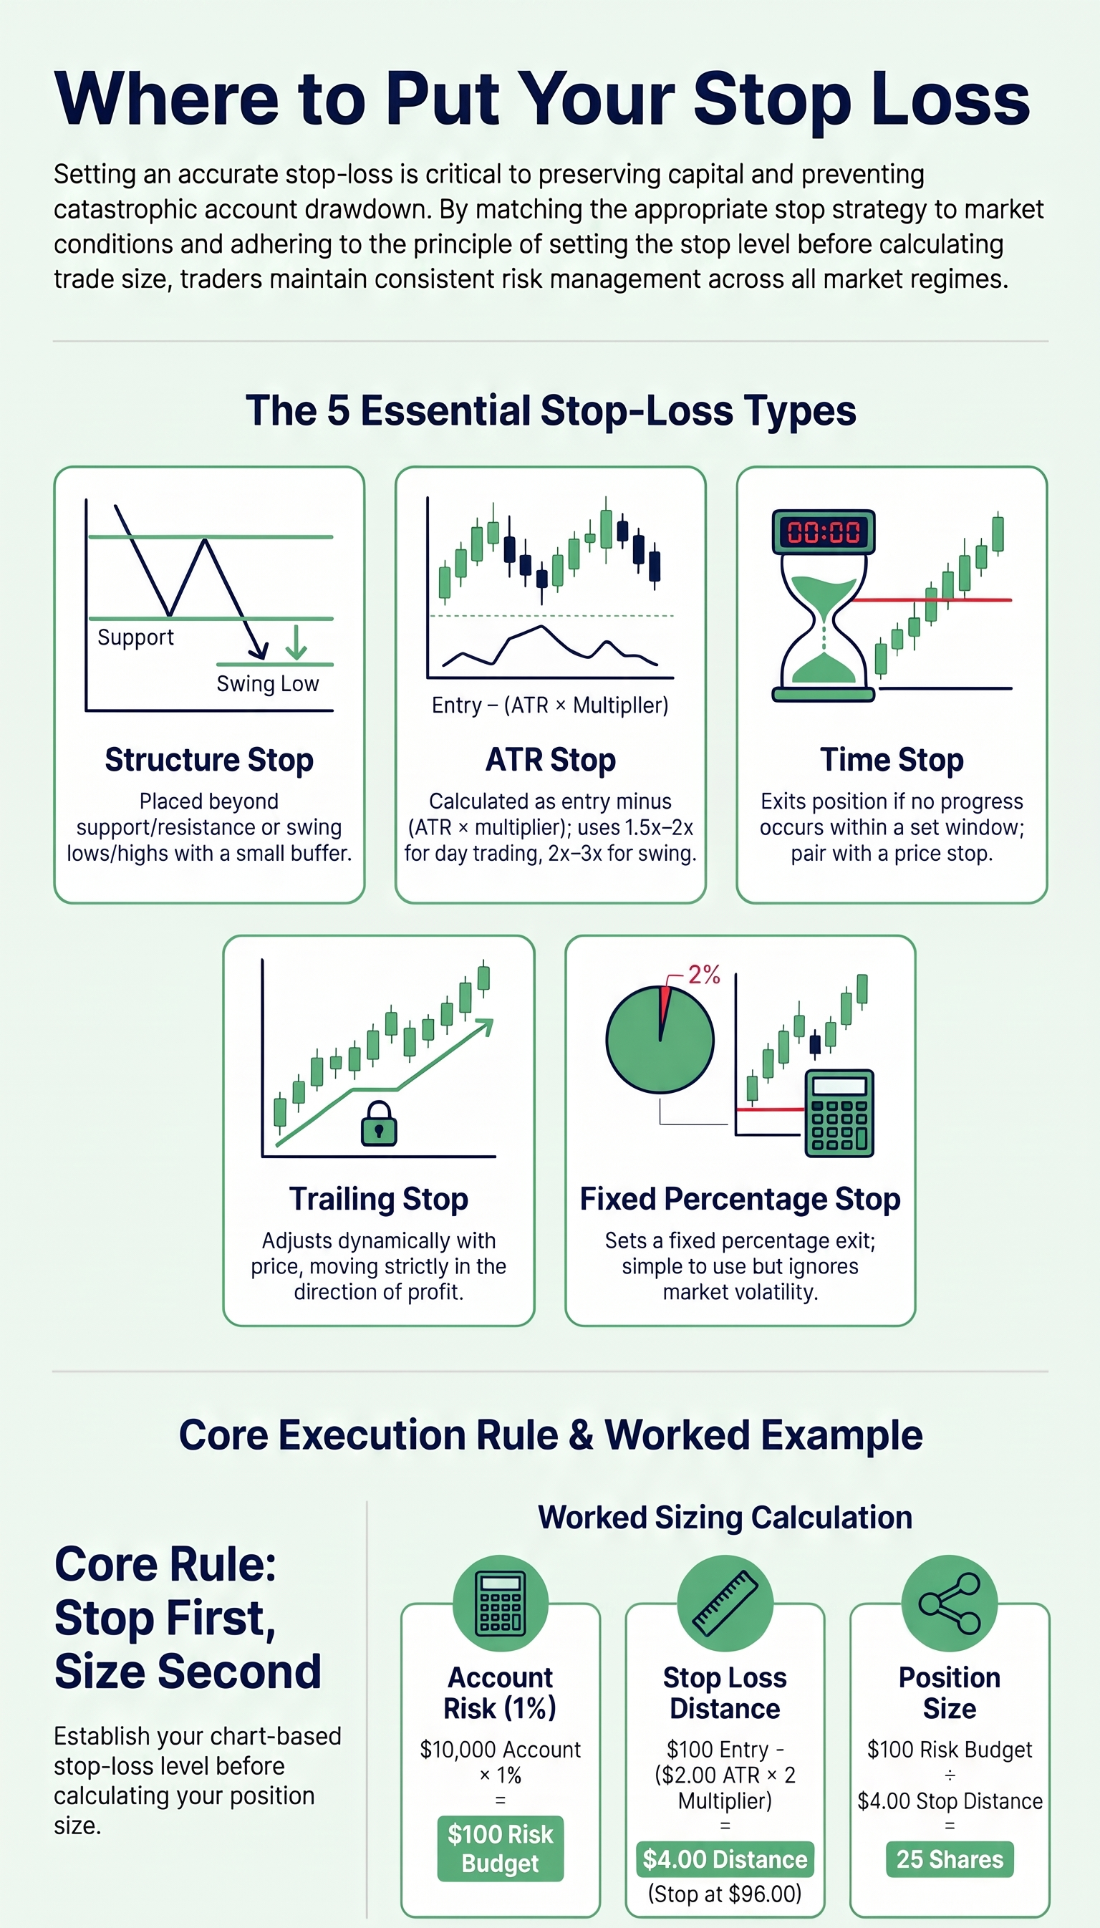
A structure-based stop (a stop placed relative to key chart levels such as support, resistance, or swing highs and lows) exits at the price that proves your original idea wrong. For a long trade, that means below a significant support level (a price area where buying has repeatedly halted declines) or below a recent swing low. For a short trade, it means above a resistance level (an area where selling has repeatedly halted advances) or above a recent swing high.
The logic is simple. If price breaks through the level your trade was built on, the reason for the trade is gone, so you leave. Structure stops follow how price actually moves, which is why sources describe them as better aligned with price action than arbitrary point stops.
There is one catch. Swing highs, swing lows and round numbers are visible to everyone, and stop orders tend to cluster right on them. Brief spikes can sweep through those clusters and then reverse. To reduce the chance of getting wicked out (stopped by a short spike that quickly reverses), add a small buffer beyond the level. One source suggests about 5 to 10 cents for stocks or 2 to 3 ticks for futures contracts.
ATR stops: let volatility set the distance
Markets go through quiet and wild periods. A fixed stop distance that works in a calm session may be far too tight on a volatile day, and normal noise will stop you out. An ATR stop (a stop set from the Average True Range indicator, which measures recent volatility) expands and contracts automatically so the distance matches current conditions.
The Average True Range, or ATR, smooths the true range (the largest of the current high-low range and the gaps to the prior close) over a set number of bars, most often 14. To place the stop, multiply the ATR by a chosen multiplier and subtract it from your entry for a long trade, or add it for a short trade.
Formulas: Long stop = Entry price − (ATR × multiplier). Short stop = Entry price + (ATR × multiplier). The sources give 1.5x to 2x as a common range for day traders and 2x to 3x for swing traders.
Worked example with a $10,000 account
Say you risk 1% of a $10,000 account per trade. That is a $100 risk budget ($10,000 × 0.01). You want to buy a stock at $100.00. The 14-period ATR reads $2.00 and your plan uses a 2x multiplier.
| Step | Calculation | Result |
|---|---|---|
| Stop distance | $2.00 ATR × 2 | $4.00 |
| Stop price | $100.00 − $4.00 | $96.00 |
| Risk budget | $10,000 × 1% | $100 |
| Position size | $100 ÷ $4.00 per share | 25 shares |
| Check | 25 shares × $4.00 | $100 maximum loss |
Notice who is in charge. The chart and the ATR set the stop price. Your account risk sets the share count. If you had decided on 100 shares first and then dragged the stop to $99 so the loss looked small, the stop would sit inside normal noise and get hit again and again. Our guide to position sizing and the 1% rule covers this side in more depth.
Time stops: get out of dead trades
A time stop (an exit rule that closes a trade if price has not moved your way within a set window) measures duration instead of price. It suits day traders, scalpers and breakout traders who need quick follow-through. For example, you buy a breakout at 9:45 a.m. and your plan says that if the stock has not advanced within 30 minutes, you close it. If it is still flat at 10:15, you leave at breakeven or a small loss.
The benefit is that your money is not tied up in a stalled trade while better setups appear elsewhere. The limit is just as important: a time stop is not a risk control by itself. It must be paired with a hard price stop, because a sudden adverse move can arrive while you are waiting out the clock.
Comparing the five stop types
| Stop type | Best suited for | How it works | Main weakness |
|---|---|---|---|
| Fixed or percentage | Beginners, uniform risk | Constant dollar, point or percent distance from entry | Ignores structure and volatility, so it can be too tight or too wide |
| Structure-based | Technical and swing traders | Beyond support, resistance or swing points | Distance changes every trade and takes chart-reading skill |
| ATR / volatility | Day traders, futures, volatile markets | ATR times a multiplier | Distance is not tied to a visible price level |
| Time-based | Scalpers and breakout traders | Closes a trade that makes no progress in the window | Not a standalone control; needs a price stop |
| Trailing | Trend followers, swing traders | Follows price at a set distance once in profit | Can be hit by normal pullbacks |
Trailing stops vs fixed stops
A fixed stop stays where you put it until the trade hits its target or the stop. A trailing stop (a stop that moves behind price as the trade works in your favor) only moves in one direction: up for longs, down for shorts. Once it ratchets to a new level it never loosens. You can trail by a fixed distance, by an ATR multiple, or by stepping the stop behind each new higher low.
Trailing lets you ride a trend without guessing the top. The trade-off is that in choppy markets a tight trail gets stopped out by routine pullbacks. If you want a deeper look at the reward side, see our risk-reward ratio guide.
Hard stops vs mental stops
A hard stop (a resting order placed with your broker that triggers automatically) works even if you step away. A mental stop (a price you plan to exit at by hand) depends on you acting in the moment. The problem is that fear and regret show up exactly when price reaches that level, and it is easy to negotiate with yourself and hold on. A mental stop also does nothing if your internet drops or the market spikes while you are not looking. For most retail traders, a real order is the safer choice.
Gaps and slippage: a stop is not a guaranteed price
Many beginners assume a stop fills at exactly their price. It does not. A standard stop is a trigger: once the market touches your level, it becomes a market order (an order to trade immediately at the best available price). In fast markets, thin liquidity or overnight gaps (price jumps between one close and the next open), you can be filled at a worse price. The difference is called slippage (the gap between the price you expected and the price you got).
Plan for it. Leave a margin in your risk calculation instead of assuming every stop fills perfectly, and be extra careful around news releases and overnight holds.
Common stop loss mistakes
Common mistake: Setting the stop too tight so you can buy more shares. A stop inside normal market noise gets triggered by routine moves before your idea has time to work.
Common mistake: Moving a stop further away as price approaches it. This turns a planned 1% loss into an unplanned, much larger one. Once set, a stop should only move in the direction of profit or to reduce risk.
Pro tip: Check your journal. If your stops are often hit just before price reverses and runs to your target, they are probably sitting inside the noise. Widen the stop and cut the position size so dollar risk stays the same. Our guide on keeping a trading journal shows what to record.
Another early habit to question is moving the stop to breakeven too soon. If you shift it before the trade has gained at least 1R (one unit of your initial risk), routine pullbacks can knock you out of trades that would have worked.
How to choose your stop method
You do not need all five at once. Match the method to how you trade and keep it consistent.
- New to trading: start with an ATR or percentage stop. The rules are objective and easy to calculate, which removes guesswork.
- Trading chart levels: use a structure stop with a small buffer, and accept that the distance will differ on each trade.
- Short-term momentum trades: add a time stop on top of a price stop so stalled trades do not tie up capital.
- Riding a trend: trail the stop behind higher lows or by an ATR multiple, and expect some pullback exits.
A five-step checklist before every trade
- Find the invalidation point. Where does the trade idea fail on the chart?
- Add a buffer. Leave a little room beyond obvious levels.
- Measure the distance. Entry price minus stop price gives your risk per share.
- Size the position. Divide your dollar risk budget by the risk per share.
- Place a real order. Enter the stop with your broker as soon as you are in, and only move it to reduce risk.
If the stop the chart demands is too wide for your account, the answer is a smaller position or no trade at all. Never a tighter stop that the market is likely to hit by chance.
FAQ
What is the best stop loss strategy for beginners?
A percentage-based or ATR-based stop is a good start because both give simple, objective rules. As your chart-reading improves, move toward structure stops placed beyond key support and resistance.
How do I know if my stop is too tight?
If your journal shows frequent stop-outs right before price reverses toward your original target, the stop is likely inside normal volatility. Widen it and reduce your size to keep the dollar risk the same.
Should I use a different ATR multiplier for day trading and swing trading?
Yes. The sources give roughly 1.5x to 2x ATR for day trading and 2x to 3x for swing trading, because longer holds need more room to absorb daily pullbacks.
Is a stop loss guaranteed to fill at my price?
No. Once triggered it becomes a market order, so gaps, news and thin liquidity can cause slippage.
The verdict
A good stop sits where your idea is wrong, gives price room to move, and is paired with a position size that keeps the loss within your risk budget. Pick one method, write down the rule, and follow it on every trade. Your next step: open your last ten trades and check whether each stop had a clear reason behind it.
Trading involves substantial risk of loss. This article is education, not financial advice.