

- What is a trading journal and why keep one?
- What should you record for every trade?
- A simple trading journal template
- How to review your journal each week
- A worked example of the weekly numbers
- Spreadsheet or journaling software?
- How to make the habit stick
- FAQ
- How many trades should I log?
- Should I journal paper trades?
- What if I skip a day?
- Do I need to record emotions?
- Is a journal worth the time if I only trade a few times a week?
- The verdict
Trading involves substantial risk of loss. This article is education, not financial advice.
Disclosure: this article contains affiliate links. If you sign up through them, Trader Edge Hub may earn a commission at no extra cost to you. We only mention tools we think fit the topic.
Most traders have a story about the trade that "just happened." They can tell you the loss, but not the setup, the size, or what they were thinking when they clicked. Without a record, you repeat the same mistakes and call it bad luck. This guide shows you how to build a trading journal, which eight items to log on every trade, and how to review it each week so the numbers start working for you.
Quick answer: A trading journal is a structured record of your trades, your rules and your state of mind. Log eight things on every trade: date and time, asset, direction, position size, entry and exit price, stop-loss and take-profit, result, and the setup. Review the whole log once a week.
What is a trading journal and why keep one?
A trading journal is a record of every position you open and close. It logs your setups, your fill prices, your risk limits, your results and your decisions. It is not a diary. It is a feedback loop that shows you how you actually trade, not how you remember trading.
The first reason to keep one is pattern spotting. Without a log, small leaks go unnoticed: overtrading on a certain day, sizing up after a loss, or exiting winners early. With a log, you see those leaks quickly and fix them before they drain your account. Reviewing your winners shows you the habits worth repeating.
The second reason is emotion. When a trade goes red, fear or anxiety can push you into an impulsive exit or revenge trading (a reckless trade taken right after a loss to win the money back). Writing down how you feel before and during a trade makes you step back and use logic. Over time, tags like "hesitation" or "greed" show you what undisciplined behavior costs you in dollars.
The third reason is accountability. When you know every order has to be written down, you pause before the impulse trade. That pause helps you follow your plan through normal drawdowns (the peak-to-trough decline in your account).
The fourth reason is finding your edge (an advantage that produces positive results over many trades). By tagging each setup, you can separate strategies with a strong win rate (the share of trades that make money) from those that drain capital. You can also calculate profit factor (gross profits divided by gross losses) and expectancy (the average amount you expect to win or lose per trade). Those numbers help you set position size at a level you can live with.
Finally, a journal teaches you to judge process, not outcome. You can follow every rule and still lose, because markets are random. You can break your plan and get lucky. A journal lets you ask whether you followed your rules, which is the part you control.
What should you record for every trade?
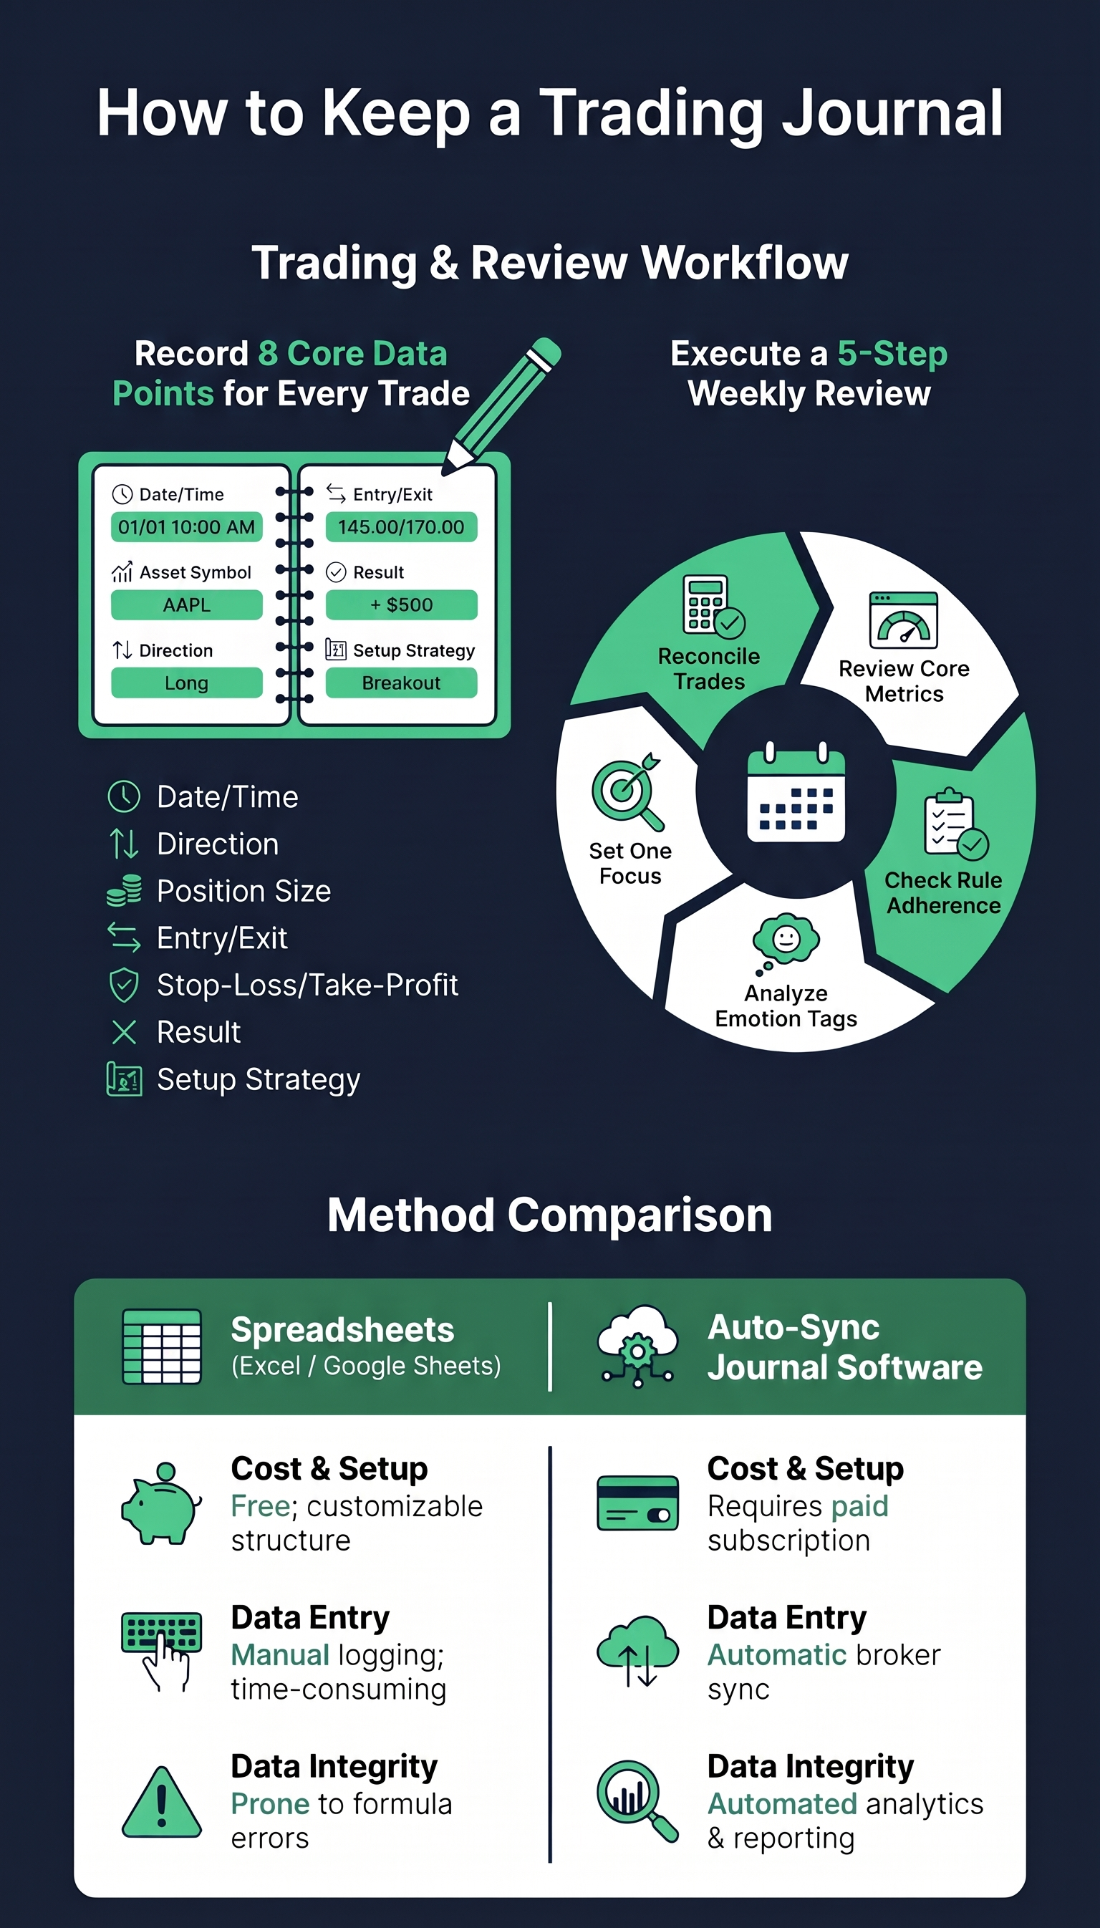
Standardize what you capture. Vague notes make later analysis useless. The sources we reviewed agree on eight data points that form the base of a good journal.
- Date and time of entry. A timestamp shows you which times of day and sessions work best for you.
- Asset symbol. The stock ticker, currency pair or crypto pair lets you see which instruments you trade well.
- Direction. Long (buying because you expect a rise) or short (selling because you expect a fall) shows whether you do better in rising or falling markets.
- Position size. Units, contracts or shares show whether your sizing is consistent and flag over-leveraging.
- Entry and exit price. Your fill prices let you measure execution and spot slippage (the gap between the price you expected and the price you got).
- Stop-loss and take-profit levels. Your planned risk shows whether you respected your stop-loss (an order that closes a losing trade at a set price) and your target.
- Result. Record the profit or loss in dollars and percent. This is the raw data for account growth.
- Strategy or setup. Label the pattern or trigger so you can measure each setup on its own and drop the ones with no edge.
When every trade has the same fields, comparing one week with another is simple. Skip even one field and you create blind spots that make it harder to see why an account is losing.
A simple trading journal template
A clean layout makes the habit fast. You can build this in a spreadsheet or in journaling software. Here is a practical layout with one filled row. The numbers are made up to show how an entry should look. They are an example, not a real trade.
| Time | Asset | Direction | Size | Entry | Exit | Stop | Target | Result | Setup |
|---|---|---|---|---|---|---|---|---|---|
| Example: Mon 09:45 | XYZ stock | Long | 100 shares | $50.00 | $52.00 | $49.00 | $53.00 | +$200 (+4.0%) | Breakout |
In this example the entry, stop and target were set before the order, which fixes the planned risk and reward ($1 of risk against $3 of reward). The trade closed at $52.00, short of the target but still a disciplined win. Labeling it "Breakout" lets you group it with similar trades later to see how that setup performs over time.
Add two more columns: notes and screenshots. A short note like "slight slippage on entry" or "felt anxious near resistance" captures the context numbers cannot. A chart screenshot at entry and exit shows what the market looked like when you acted. Weeks later, these two columns bring the trade back better than the numbers alone.
Build a routine around it. Before the market opens, write down your plan: key levels and setups you will trade. Fill in the details right after you take a position. Record your final thoughts when the market closes. Then review everything once a week, on the weekend.
How to review your journal each week
Logging is half the job. The gains come when you step back and study the data. Set aside a regular weekly session and follow these five steps.
- Reconcile your trades. Import or check every fill from your broker. Make sure no order is missing or duplicated, so your numbers are complete.
- Work out your core numbers. Calculate win rate, average win (the average gain on winning trades), average loss (the average loss on losing trades), profit factor, expectancy and average R-multiple (results expressed as a multiple of your initial risk).
- Check rule adherence. Compare trades where you followed your plan with trades where you did not. If your results are better when you follow the rules, your rules have an edge.
- Review your emotion tags. Look at trades tagged with FOMO (fear of missing out) or revenge trading, and add up what those trades cost you.
- Pick one focus for next week. Choose your single biggest mistake from the week and work on that one thing until it disappears.
A worked example of the weekly numbers
Here is how step 2 looks with made-up numbers. Say you logged 10 trades in a week. Six were winners that averaged $150 each. Four were losers that averaged $100 each. Your risk on each trade (1R) was $100.
| Metric | How to calculate it | Example result |
|---|---|---|
| Win rate | Winning trades divided by total trades | 6 / 10 = 60% |
| Average win | Total profit of winners divided by number of winners | $900 / 6 = $150 |
| Average loss | Total loss of losers divided by number of losers | $400 / 4 = $100 |
| Profit factor | Gross profits divided by gross losses | $900 / $400 = 2.25 |
| Expectancy | (Win rate x average win) minus (loss rate x average loss) | (0.6 x $150) - (0.4 x $100) = $50 per trade |
| Average R-multiple | Result divided by your initial risk | Wins average +1.5R, losses -1R |
These numbers are an illustration, not a benchmark. Your own results will differ, and ten trades are too few to prove anything. The point is the routine: once the same fields are in the log every time, the math takes a few minutes, and you can watch the numbers change as your sample grows.
Pro tip: Take a chart screenshot at both entry and exit. It captures the setup quality and market context that raw numbers cannot show.
Spreadsheet or journaling software?
Where you keep the journal depends on how often you trade, how comfortable you are with spreadsheets and how much time you have. Both do the core job. They differ in workflow.
| Spreadsheet | Auto-sync journaling software | |
|---|---|---|
| Cost | Free with a spreadsheet app you already use | Usually a paid monthly or yearly subscription |
| Effort | Higher: manual entry and formula setup | Lower: imports your trades in the background |
| Automation | None: you copy, paste and clean data | High: syncs orders and calculates reports |
| Best for | Beginners and traders with a low number of trades each month | Active traders with 20 or more trades a month or several accounts |
A good rule: start with a spreadsheet. If manual entry starts to feel slow or error-prone, usually somewhere past 20 or so trades a month, look at software that syncs with your broker. Check pricing and broker support before you pay.
Common mistake: Judging a trade only by its result, or changing your tag definitions halfway through a review. A losing trade can follow a perfect plan, and a winning trade can come from breaking every rule. Tag the process, not the profit.
Keeping a journal pairs well with the rest of your risk plan. If you have not read them yet, see our guides to position sizing and the 1% rule and to what changed when the PDT rule was replaced.
How to make the habit stick
Most journals die within a few weeks, not because the idea is wrong but because the process is too heavy. Keep it light. Use the same template every time so you never have to think about the format. Log the trade right after you place it, while the reasoning is fresh, and finish the result when you close it.
Make the weekly review a fixed appointment, such as Saturday morning, and keep it short. Thirty focused minutes beats a long session you keep postponing. If you skip a week, do not abandon the journal. Reconcile the missing trades from your broker statement and carry on.
Finally, keep the journal honest. Record the bad trades with the same care as the good ones, and write down the rule you broke. The goal is not a pretty equity curve in a spreadsheet. The goal is to learn what you actually do when money is on the line, so you can fix it.
FAQ
How many trades should I log?
Log every trade, including small losses and quick scalps. Skipping them creates blind spots and distorts your reports. Patterns usually start to show after around 50 to 100 logged trades, and automated analysis works best with 200 or more.
Should I journal paper trades?
Yes, if you use paper trading (simulated trades with virtual money) to test setups. Logging them helps you check your rules and timing before you risk real money. Treat the results with care, because simulated fills are not the same as live ones.
What if I skip a day?
Fill the gap as soon as you can. Pull your broker statement or an export file and reconcile the missing orders. A broken record makes your weekly numbers unreliable.
Do I need to record emotions?
Yes. Tagging feelings like hesitation, anxiety or overconfidence lets you see which triggers lead to losses. It turns a vague feeling into something you can measure.
Is a journal worth the time if I only trade a few times a week?
Yes. A small number of trades makes each one more important, and a short log is quick to keep. You will reach a useful sample more slowly, but the habit of recording your reasoning pays off from the first week.
The verdict
A trading journal is one of the cheapest edges you can build. It costs a few minutes a day and gives you data on your own behavior, which no chart can. Consistency matters more than the tool. Your next step: pick a layout, log your next 10 trades with all eight fields, and run your first weekly review.
Trading involves substantial risk of loss. This article is education, not financial advice.