

- What are SCHD and VOO, and which indexes do they track?
- What is SCHD?
- What is VOO?
- How are SCHD and VOO built differently?
- How do SCHD and VOO fees and yields compare?
- How have SCHD and VOO performed on total return, and why does the period matter?
- How are SCHD and VOO dividends taxed?
- Should you hold SCHD, VOO or both?
- How do the numbers work on a $5,000 account?
- What are the most common SCHD vs VOO mistakes?
- Which tools help you compare and trade SCHD and VOO?
- Test yourself: SCHD vs VOO quiz
- FAQ
- Which ETF has a lower annual expense ratio, SCHD or VOO?
- Can you hold both SCHD and VOO in the same portfolio?
- Which ETF paid higher total returns over the past 10 years?
- How often do SCHD and VOO pay dividend distributions?
- Is SCHD safer than VOO during stock market declines?
- Which account type is best for holding SCHD?
- The verdict
Investing involves risk: investments can go down as well as up, and you may get back less than you put in. Past performance does not guarantee future results, and you should check your local tax rules. This article is education, not financial advice.
Disclosure: this article contains affiliate links. If you sign up through them, Trader Edge Hub may earn a commission at no extra cost to you. We only mention tools we think fit the topic.
Evaluating an investment in SCHD vs VOO is a fundamental decision for long-term equity investors. Choosing between dividend-focused quality screening and broad market-cap weighting shapes your income, sector exposure, and capital growth. At Trader Edge Hub, we examine official disclosures and market data to compare both exchange-traded funds [ETFs].
Quick answer: SCHD focuses on 100 high-yielding US stocks with 0.06% annual fees and a 3.14% SEC yield. VOO tracks the S&P 500 across 500 large companies with 0.03% annual fees and a 0.98% SEC yield. SCHD generates higher current income, while VOO offers greater technology exposure and broad market growth.
What are SCHD and VOO, and which indexes do they track?
What is SCHD?
Schwab US Dividend Equity ETF [SCHD] is a passive fund managed by Charles Schwab Asset Management. According to Schwab disclosures, the fund launched on October 20, 2011 on NYSE Arca. Its goal is to track the total return of the Dow Jones US Dividend 100 Index before fees.
According to S&P Dow Jones Indices methodology, the index measures high-dividend US companies with fundamental financial strength. All index components must sustain at least 10 consecutive years of dividend payments. Eligible stocks must also hold a minimum float-adjusted market capitalization of $500 million.
The index ranks eligible stocks by cash flow to debt, return on equity [ROE], dividend yield, and 5-year dividend growth rate. According to MEMX disclosures, no single stock can exceed a 4.5% weight, and no sector can exceed 25% at reconstitution. The index reconstitutes annually in March and rebalances quarterly.
According to Schwab data as of October 28, 2026, SCHD holds 102 positions with $118.36 billion in net assets. Schwab lists SCHD's turnover rate at 40.61% as of September 30, 2026. Morningstar places SCHD inside the Large Value fund category.
What is VOO?
Vanguard S&P 500 ETF [VOO] is an exchange-traded share class of the Vanguard 500 Index Fund. According to Vanguard disclosures dated April 28, 2026, VOO tracks the S&P 500 Index. According to MarketXLS data, VOO launched on September 6, 2010 on NYSE Arca.
According to S&P Dow Jones Indices disclosures, S&P 500 companies derive roughly 72% of revenues domestically and 28% internationally. An S&P committee selects 500 leading US companies based on market capitalization, liquidity, and profitability criteria. VOO employs a full replication indexing strategy by holding each stock in index proportion.
According to ETF Overlap Tool data as of October 29, 2026, VOO holds 503 equity positions. Vanguard disclosures show VOO recorded a low 2% portfolio turnover rate during its latest fiscal year. According to MarketXLS data as of October 2026, VOO holds over $1.0 trillion in net assets. Morningstar classifies VOO inside the Large Blend category.
How are SCHD and VOO built differently?
Although both funds hold large-cap US equities, their index rules create contrasting portfolio structures. According to ETF Overlap Tool data as of October 29, 2026, SCHD holds 99 equity lines while VOO holds 503 equity lines. VOO weights companies purely by market size, allowing massive tech companies to dominate top holdings.
Conversely, SCHD filters companies through dividend sustainability screens and applies a 4.5% single-stock weight cap. According to Investor Intellect research as of September 2026, VOO allocates 37.9% of its portfolio to Information Technology. On that date, SCHD held zero weight in tech giants like NVIDIA, Apple, Microsoft, Amazon, Alphabet, Meta, and Tesla.
According to Schwab data on September 30, 2026, SCHD's top sectors were Consumer Staples at 19.97%, Health Care at 19.20%, and Energy at 15.38%. According to ETF Overlap Tool data for October 2026, VOO's top sectors were Information Technology [37.84%], Financials [11.10%], and Health Care [9.28%]. VOO holds 31.0 percentage points more technology exposure than SCHD.
According to ETF Overlap Tool data as of October 29, 2026, SCHD and VOO share a 7.7% weight overlap across 46 common holdings. SCHD's top 10 positions account for 41.7% of fund weight, while VOO's top 10 account for 39.1%. Adding VOO alongside SCHD introduces 457 unique stock holdings that SCHD does not own.
Pro tip: Holding both SCHD and VOO in a portfolio provides effective factor diversification. According to ETF Overlap Tool analysis, the low 7.7% weight overlap allows investors to combine value dividend yield with broad technology growth.
How do SCHD and VOO fees and yields compare?
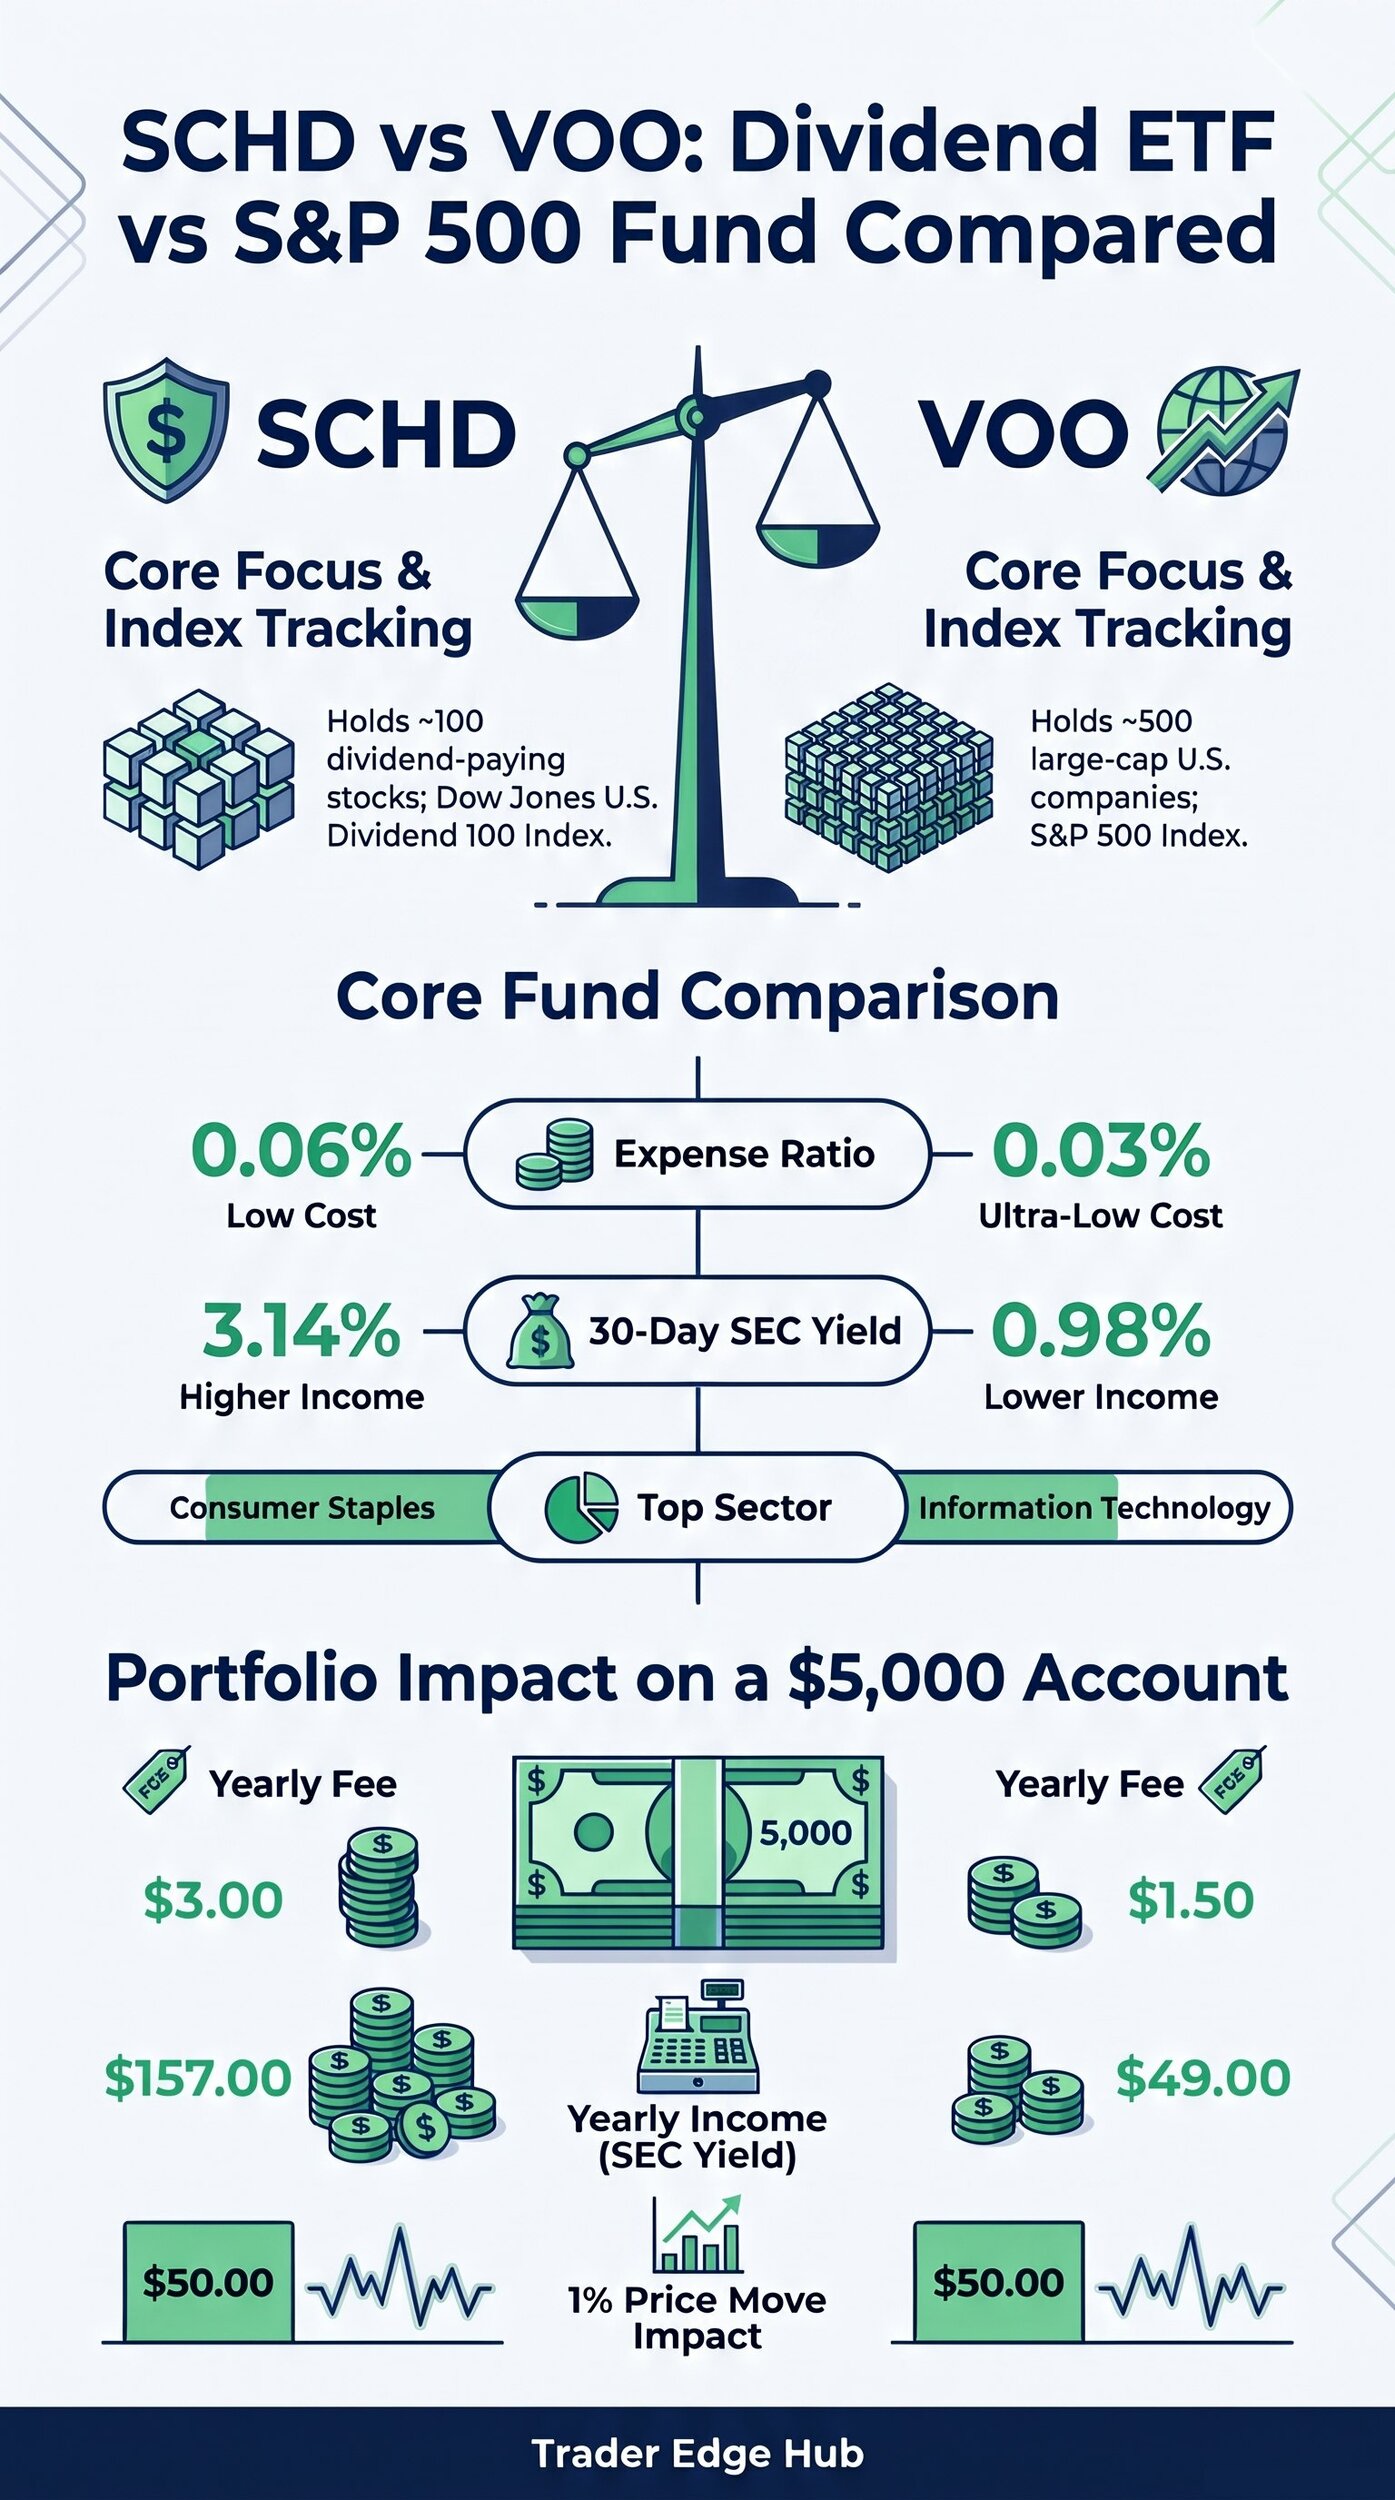
Minimizing annual operating expenses remains a critical factor for long-term compounding. According to Vanguard Summary Prospectus disclosures, VOO charges an annual expense ratio of 0.03%. According to Schwab Asset Management disclosures, SCHD charges a Total Expense Ratio of 0.060%.
According to prospectus cost examples, a $10,000 investment in VOO incurs $3 in annual fees assuming a 5% return. That same $10,000 investment in SCHD incurs $6 in annual fees, creating a $3 annual difference per $10,000 invested. According to Dr Wealth research, passive index ETFs average good expense ratios at or below 0.09%.
| Metric Comparison | SCHD [Schwab US Dividend Equity] | VOO [Vanguard S&P 500 ETF] | Source & As-Of Date |
|---|---|---|---|
| Underlying Index Tracked | Dow Jones US Dividend 100 Index | S&P 500 Index | Schwab / Vanguard Disclosures |
| Total Holdings Count | 102 holdings | 503 holdings | Schwab 10/28/2026 / ETF Overlap Tool 10/29/2026 |
| Annual Expense Ratio | 0.06% [0.060%] | 0.03% | Schwab / Vanguard Prospectuses 2026 |
| 30-Day SEC Yield | 3.14% | 0.98% | Schwab 10/27/2026 / Investor Intellect 08/31/2026 |
| Top Sector Allocations | Consumer Staples 19.97%, Health Care 19.20%, Energy 15.38% | Information Technology 37.84%, Financials 11.10%, Health Care 9.28% | Schwab 09/30/2026 / ETF Overlap Tool 10/2026 |
| Holdings Weight Overlap | 7.7% weight overlap | 7.7% weight overlap | ETF Overlap Tool 10/29/2026 |
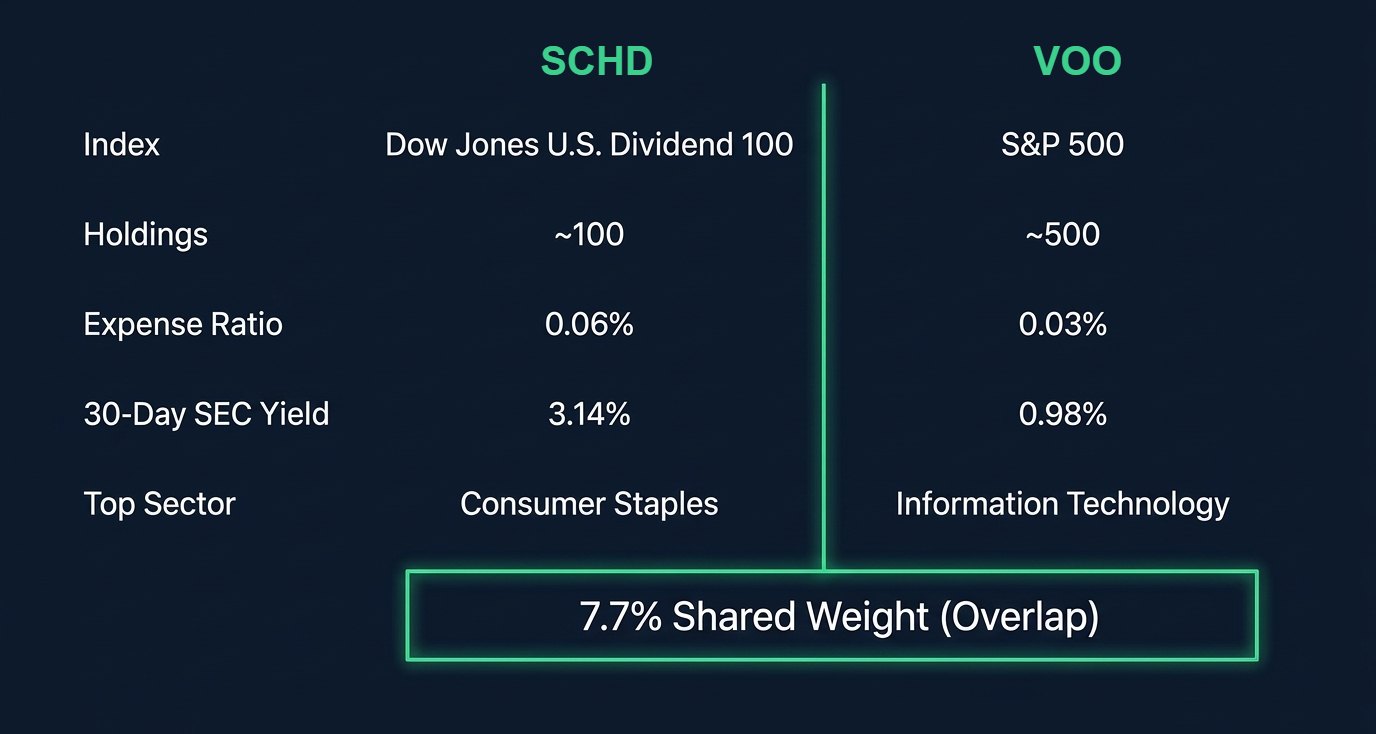
Dividend yields represent the primary cash flow distinction between SCHD and VOO. According to Schwab disclosures, SCHD posted a 30-Day SEC Yield of 3.14% as of October 27, 2026. According to Investor Intellect research, VOO posted a 30-Day SEC Yield of 0.98% as of August 31, 2026.
According to Schwab data as of September 30, 2026, SCHD recorded a trailing twelve-month distribution yield of 3.24%. According to MarketXLS data, VOO recorded a trailing dividend yield of 1.06% over that timeframe. On a $10,000 investment, SCHD generates roughly $314 to $324 in annual income versus $98 to $106 for VOO.
According to Schwab distribution schedules, SCHD pays quarterly dividends in March, June, September, and December. According to Fortune Index research, SCHD's per-share dividend payout grew at an 11.2% annualized rate from 2017 to 2025. According to Fortune Index research, VOO's dividend per share grew at approximately 6.0% annually over the past decade.
Common mistake: Focusing solely on dividend yield while ignoring total return is a frequent investor error. According to Testfolio research, total return reflects price appreciation and reinvested distributions combined.
How have SCHD and VOO performed on total return, and why does the period matter?
Evaluating long-term performance requires analyzing total return figures across different market cycles. Total return includes both capital price changes and reinvested dividend distributions combined. According to Fortune Index disclosures, time horizon selection impacts which fund leads return rankings.
According to Schwab disclosures as of September 30, 2026, SCHD generated a 10-year annualized NAV return of 12.44%. Over that same 10-year period ending September 30, 2026, Fortune Index reports show VOO delivered an annualized return of 15.30%. On a $10,000 initial balance, VOO grew to about $41,500 versus about $32,300 for SCHD over that decade.
Shorter timeframes highlight how sector shifts alter performance leadership between value and growth. According to Fortune Index research as of September 30, 2026, VOO averaged 13.70% annually over 5 years versus 9.50% for SCHD. Over 3 years, VOO averaged 22.90% annually versus 15.40% for SCHD according to Fortune Index figures.
However, SCHD demonstrated stronger downside resilience during tech-led market drawdowns. According to PortfoliosLab historical data, SCHD lost only 3.26% in 2022 while VOO declined 18.17% during aggressive rate hikes. According to Fortune Index disclosures, SCHD also led performance year-to-date through September 30, 2026, returning 21.50% versus 12.70% for VOO.
How are SCHD and VOO dividends taxed?
Tax efficiency represents an essential consideration when holding equity index funds inside taxable accounts. According to Institute of Business & Finance guides, most dividend distributions from SCHD and VOO qualify for preferential tax treatment. Qualified dividends are taxed at federal long-term capital gains rates of 0%, 15%, or 20% based on income.
Because SCHD generates a higher 3.14% SEC yield, it creates a larger annual taxable distribution than VOO's 0.98% yield. According to Schwab disclosures as of September 30, 2026, SCHD recorded a 10-year annualized tax cost ratio of 1.01%. Holding dividend funds inside tax-advantaged accounts like Roth IRAs eliminates current annual tax drag.
Should you hold SCHD, VOO or both?
Determining whether to hold SCHD, VOO, or a combination depends on your income requirements and risk profile. SCHD suits investors seeking higher current cash flow and lower tech concentration. According to Morningstar category classifications, SCHD provides value-oriented equity exposure across consumer staples and healthcare.
VOO suits investors seeking broad S&P 500 market exposure and capital growth driven by technology leaders. According to Vanguard disclosures, VOO offers low-cost access to 500 leading American corporations. Combining both funds provides effective factor diversification due to their low 7.7% weight overlap.
How do the numbers work on a $5,000 account?
To demonstrate practical cost and cash flow mechanics, consider a $5,000 investment in each fund. In risk management models, a 1% portfolio risk parameter equals $50 on a $5,000 balance. The table below shows exact annual fee, dividend yield, and price sensitivity comparisons.
| Account Parameter | SCHD [Schwab US Dividend Equity] | VOO [Vanguard S&P 500 ETF] | Source & Calculation Math |
|---|---|---|---|
| Initial Account Balance | $5,000.00 | $5,000.00 | Hypothetical worked example baseline |
| Annual Operating Expense Fee | $3.00 [0.06% x $5,000] | $1.50 [0.03% x $5,000] | Schwab / Vanguard Prospectuses 2026 |
| Annual Income at 30-Day SEC Yield | $157.00 [3.14% x $5,000] | $49.00 [0.98% x $5,000] | Schwab 10/27/2026 / Investor Intellect 08/31/2026 |
| 1% Portfolio Price Movement Value | $50.00 [1.00% x $5,000] | $50.00 [1.00% x $5,000] | Standard 1% price fluctuation value |
| 1% Price Moves Equal to Annual SCHD Income | 3.14 moves [$157.00 / $50.00] | N/A [SCHD benchmark comparison] | Income relative to 1% price movement |
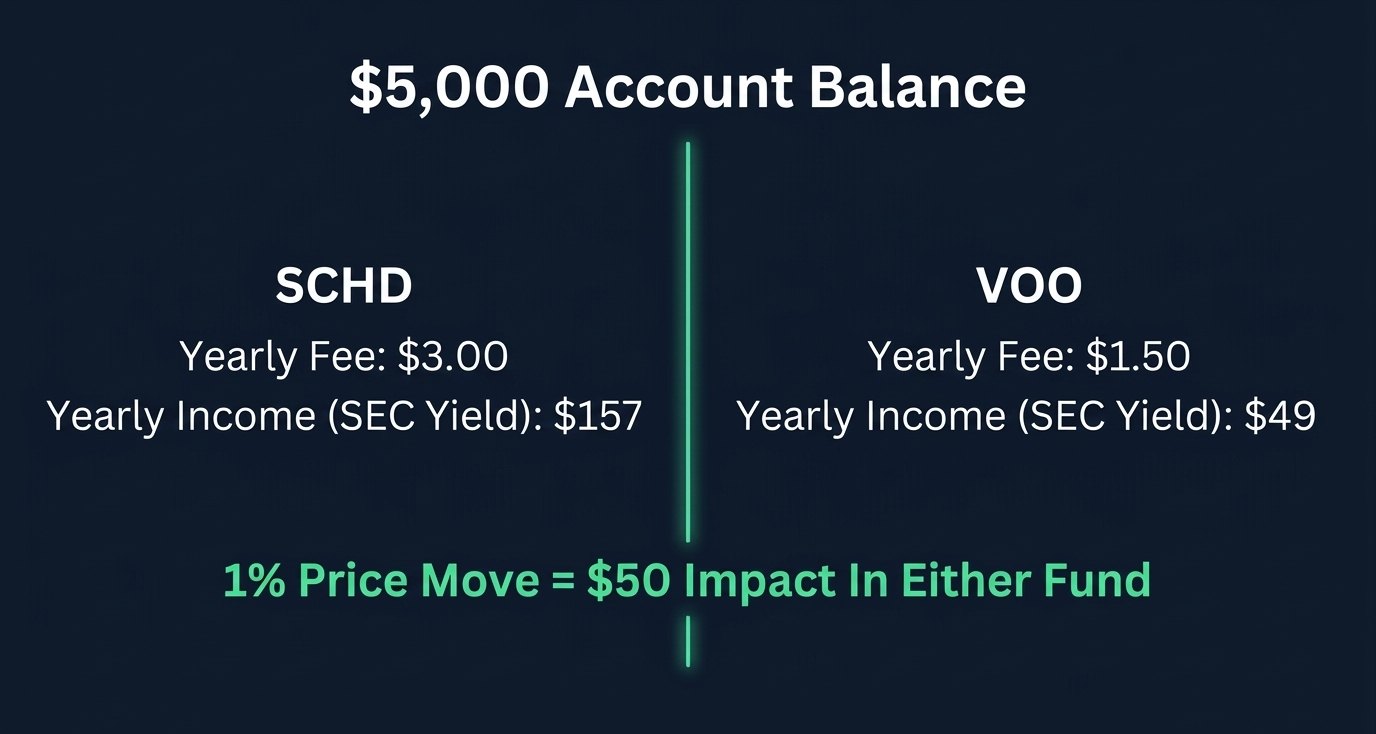
On a $5,000 position, SCHD generates $157.00 in annual income at its 3.14% SEC yield versus $49.00 for VOO. It takes just 3.14 single-percentage-point price moves [$50.00 each] to equal SCHD's total annual cash distribution. Understanding this price sensitivity helps contextualize dividend income relative to market volatility.
What are the most common SCHD vs VOO mistakes?
Avoiding frequent analytical errors helps investors build balanced portfolios. Based on institutional research, we identified six common mistakes retail investors make when comparing SCHD and VOO.
- Confusing dividend yield with total return: Assuming a higher yield means a higher total return is a mistake. According to Testfolio research, total return reflects price appreciation and reinvested distributions combined.
- Ignoring tech sector concentration: Failing to realize VOO holds 37.84% in tech leads to unexpected volatility. According to ETF Overlap Tool data, VOO holds 31.0 percentage points more technology than SCHD.
- Overlooking tax drag in taxable accounts: Holding SCHD in taxable accounts creates higher annual dividend taxes. According to Schwab disclosures, SCHD recorded a 1.01% annualized 10-year tax cost ratio.
- Assuming SCHD is a bond replacement: Treating SCHD as a bond proxy ignores equity downside risks. According to PortfoliosLab data, SCHD experienced a maximum drawdown of 33.37% during market declines.
- Chasing short-term annual performance: Switching funds based on 1-year returns harms compounding. According to Fortune Index research, market leadership alternates between value and growth sectors.
- Duplicating holdings unnecessarily: Buying multiple dividend funds often creates portfolio overlap. To evaluate ETF metrics before buying, read our guide on 10 Things to Check Before You Buy an ETF.
Which tools help you compare and trade SCHD and VOO?
Modern analytical platforms allow retail investors to evaluate ETF holdings and execute trades efficiently. These tools can help you research funds and manage positions, but they do not remove market risk.
To schedule commission-free recurring investments and buy fractional shares, explore Robinhood. To analyze institutional factor scores and fund holdings using artificial intelligence, use Kavout. To chart long-term price histories and technical trends, explore TradingView.
For broader asset allocation strategies, read our guide on How to Build a Simple 3-ETF Portfolio. To learn about dollar-cost averaging steps, review What Happens If You Invest $100 a Month? Dollar-Cost Averaging. For fixed income balance, read Bonds Explained for Stock Investors.
Test yourself: SCHD vs VOO quiz
1. What is the annual expense ratio difference between SCHD and VOO on a $10,000 balance?
A) $3.00 per year.
B) $30.00 per year.
C) $300.00 per year.
D) $0.00 per year.
Answer: A. VOO charges 0.03% [$3] and SCHD charges 0.06% [$6], creating a $3 annual difference per $10,000.
2. How much holdings weight overlap do SCHD and VOO share according to ETF Overlap Tool data?
A) 50.0%.
B) 25.0%.
C) 7.7%.
D) 0.0%.
Answer: C. According to ETF Overlap Tool data, SCHD and VOO share a low 7.7% weight overlap across 46 holdings.
3. Which sector represents VOO's largest single weighting as of recent fund disclosures?
A) Consumer Staples.
B) Information Technology.
C) Energy.
D) Health Care.
Answer: B. According to ETF Overlap Tool data, Information Technology represents 37.84% of VOO's total portfolio.
4. What requirement must companies meet to enter the Dow Jones US Dividend 100 Index?
A) Generate over $100 billion in annual tech revenue.
B) Sustain at least 10 consecutive years of dividend payments.
C) Maintain an annual expense ratio below 0.01%.
D) Operate exclusively in the financial services sector.
Answer: B. According to S&P Dow Jones Indices, components must hold 10 consecutive years of dividend payments.
5. Why does SCHD generate higher current cash distributions than VOO?
A) SCHD charges higher management fees that get paid out to shareholders.
B) SCHD screens for high-yielding dividend stocks while VOO holds low-yielding tech growth stocks.
C) SCHD holds short-term Treasury bonds that pay interest.
D) SCHD reinvests every dividend automatically for you.
Answer: B. SCHD screens specifically for high dividend yields, whereas VOO holds major low-yield technology stocks.
FAQ
Which ETF has a lower annual expense ratio, SCHD or VOO?
VOO has a lower expense ratio at 0.03% per year, compared to 0.06% for SCHD. According to Vanguard disclosures, VOO costs $3 annually per $10,000 invested versus $6 for SCHD. Both funds charge fees well below industry averages.
Can you hold both SCHD and VOO in the same portfolio?
Yes, holding both funds provides effective factor diversification. According to ETF Overlap Tool data as of October 2026, SCHD and VOO share only 7.7% weight overlap. Combining them allows you to pair value dividend yields with broad market technology growth.
Which ETF paid higher total returns over the past 10 years?
VOO delivered higher total returns over the past 10-year period. According to Fortune Index disclosures as of September 30, 2026, VOO averaged 15.30% annually over 10 years versus 12.44% for SCHD. Total return figures include reinvested dividends.
How often do SCHD and VOO pay dividend distributions?
Both SCHD and VOO distribute dividends to shareholders on a quarterly schedule. According to Schwab disclosures, SCHD pays distributions in March, June, September, and December. Vanguard follows a similar quarterly distribution calendar for VOO.
Is SCHD safer than VOO during stock market declines?
SCHD has held up better during tech-led sell-offs due to its defensive value sector weightings. According to PortfoliosLab data, SCHD lost 3.26% in 2022 while VOO lost 18.17%. However, both funds carry equity risk and can decline during broad market crashes.
Which account type is best for holding SCHD?
Tax-advantaged accounts like Roth IRAs or traditional IRAs suit SCHD best. According to Schwab disclosures, SCHD's 3.14% yield creates an annual tax cost ratio of 1.01% in taxable accounts. Sheltering distributions inside retirement accounts prevents annual tax drag.
The verdict
Choosing between SCHD and VOO depends on whether you prioritize higher current dividend income or broad market technology growth. VOO has delivered higher total returns over multi-year periods, while SCHD offers higher cash yields and value resilience. Your next step: write down your income goal and time horizon, then check which fund, or which mix, fits that plan.
Sources: Schwab Asset Management SCHD disclosures, Vanguard Summary Prospectus VOO disclosures, S&P Dow Jones Indices methodology, ETF Overlap Tool analysis, Fortune Index research, PortfoliosLab historical performance data, Testfolio total return analysis, MarketXLS fund comparison data, Investor Intellect research, Dr Wealth ETF expense ratio study, Institute of Business & Finance asset location guide.
Investing involves risk: investments can go down as well as up, and you may get back less than you put in. Past performance does not guarantee future results, and you should check your local tax rules. This article is education, not financial advice.