

- What is dollar cost averaging?
- How does the same $100 buy more shares when prices fall?
- What could $100 a month grow to over 10, 20 or 30 years?
- How do you set up a $100-a-month plan?
- Is dollar cost averaging better than investing a lump sum?
- What does a worked example of $100 a month look like?
- What are the most common dollar cost averaging mistakes?
- Which tools help you automate $100 a month?
- Test yourself: dollar cost averaging quiz
- FAQ
- Is dollar cost averaging suitable for beginners?
- What is the best frequency for dollar cost averaging?
- Should you use dollar cost averaging in a tax-advantaged account?
- Can dollar cost averaging prevent investment losses?
- How does dollar cost averaging differ from value averaging?
- What should you do with a large cash lump sum?
- The verdict
Investments can go down as well as up, and you may get back less than you put in. Past performance does not guarantee future results. Check local tax rules. This article is education, not financial advice.
Disclosure: this article contains affiliate links. If you sign up through them, Trader Edge Hub may earn a commission at no extra cost to you. We only mention tools we think fit the topic.
Building wealth through long-term investing does not require a large upfront fortune. Many beginner investors ask what happens when you use dollar cost averaging with small monthly sums. By transferring $100 every month into broad index funds, you remove emotional timing errors and accumulate shares systematically. At Trader Edge Hub, we examine real historical data to show how steady deposits grow over time.
Quick answer: Investing $100 a month lowers timing risk by purchasing more shares when market prices drop. Over a 30-year period at an assumed 7% real return, $36,000 in cash contributions grows to about $121,997 in purchasing power. Automating monthly index purchases ensures disciplined execution through volatile market cycles.
What is dollar cost averaging?
Dollar cost averaging [DCA] means investing a fixed sum of money at regular scheduled intervals. According to Investor.gov documentation, this strategy distributes capital across changing market cycles regardless of price fluctuations. You buy fewer shares when asset prices rise and more shares when prices drop.
For salaried retail investors, this process occurs naturally through regular paycheck contributions. According to FINRA investor guides, transferring fixed funds into a 401(k) or brokerage account automates wealth accumulation. You avoid the stress of predicting short-term market tops and bottoms.
Conversely, investing a large lump sum exposes all your capital to immediate market timing risk. According to Kennesaw State University research, dollar cost averaging reduces entry-point volatility for new investors. Spreading deposits over time prevents making large purchases right before a severe market decline.
Historical market data demonstrates why dollar cost averaging appeals to risk-conscious investors. According to Northwestern Mutual research, market timing or sitting on excess cash costs investors performance over long periods. Automating monthly contributions converts salary income into productive capital without emotional hesitation.
Furthermore, dollar cost averaging eliminates the psychological regret of buying at a market peak. According to Vanguard 2012 research, cash allocations during dollar cost averaging reduce short-term portfolio drawdowns. This emotional buffer keeps investors disciplined through temporary market corrections.
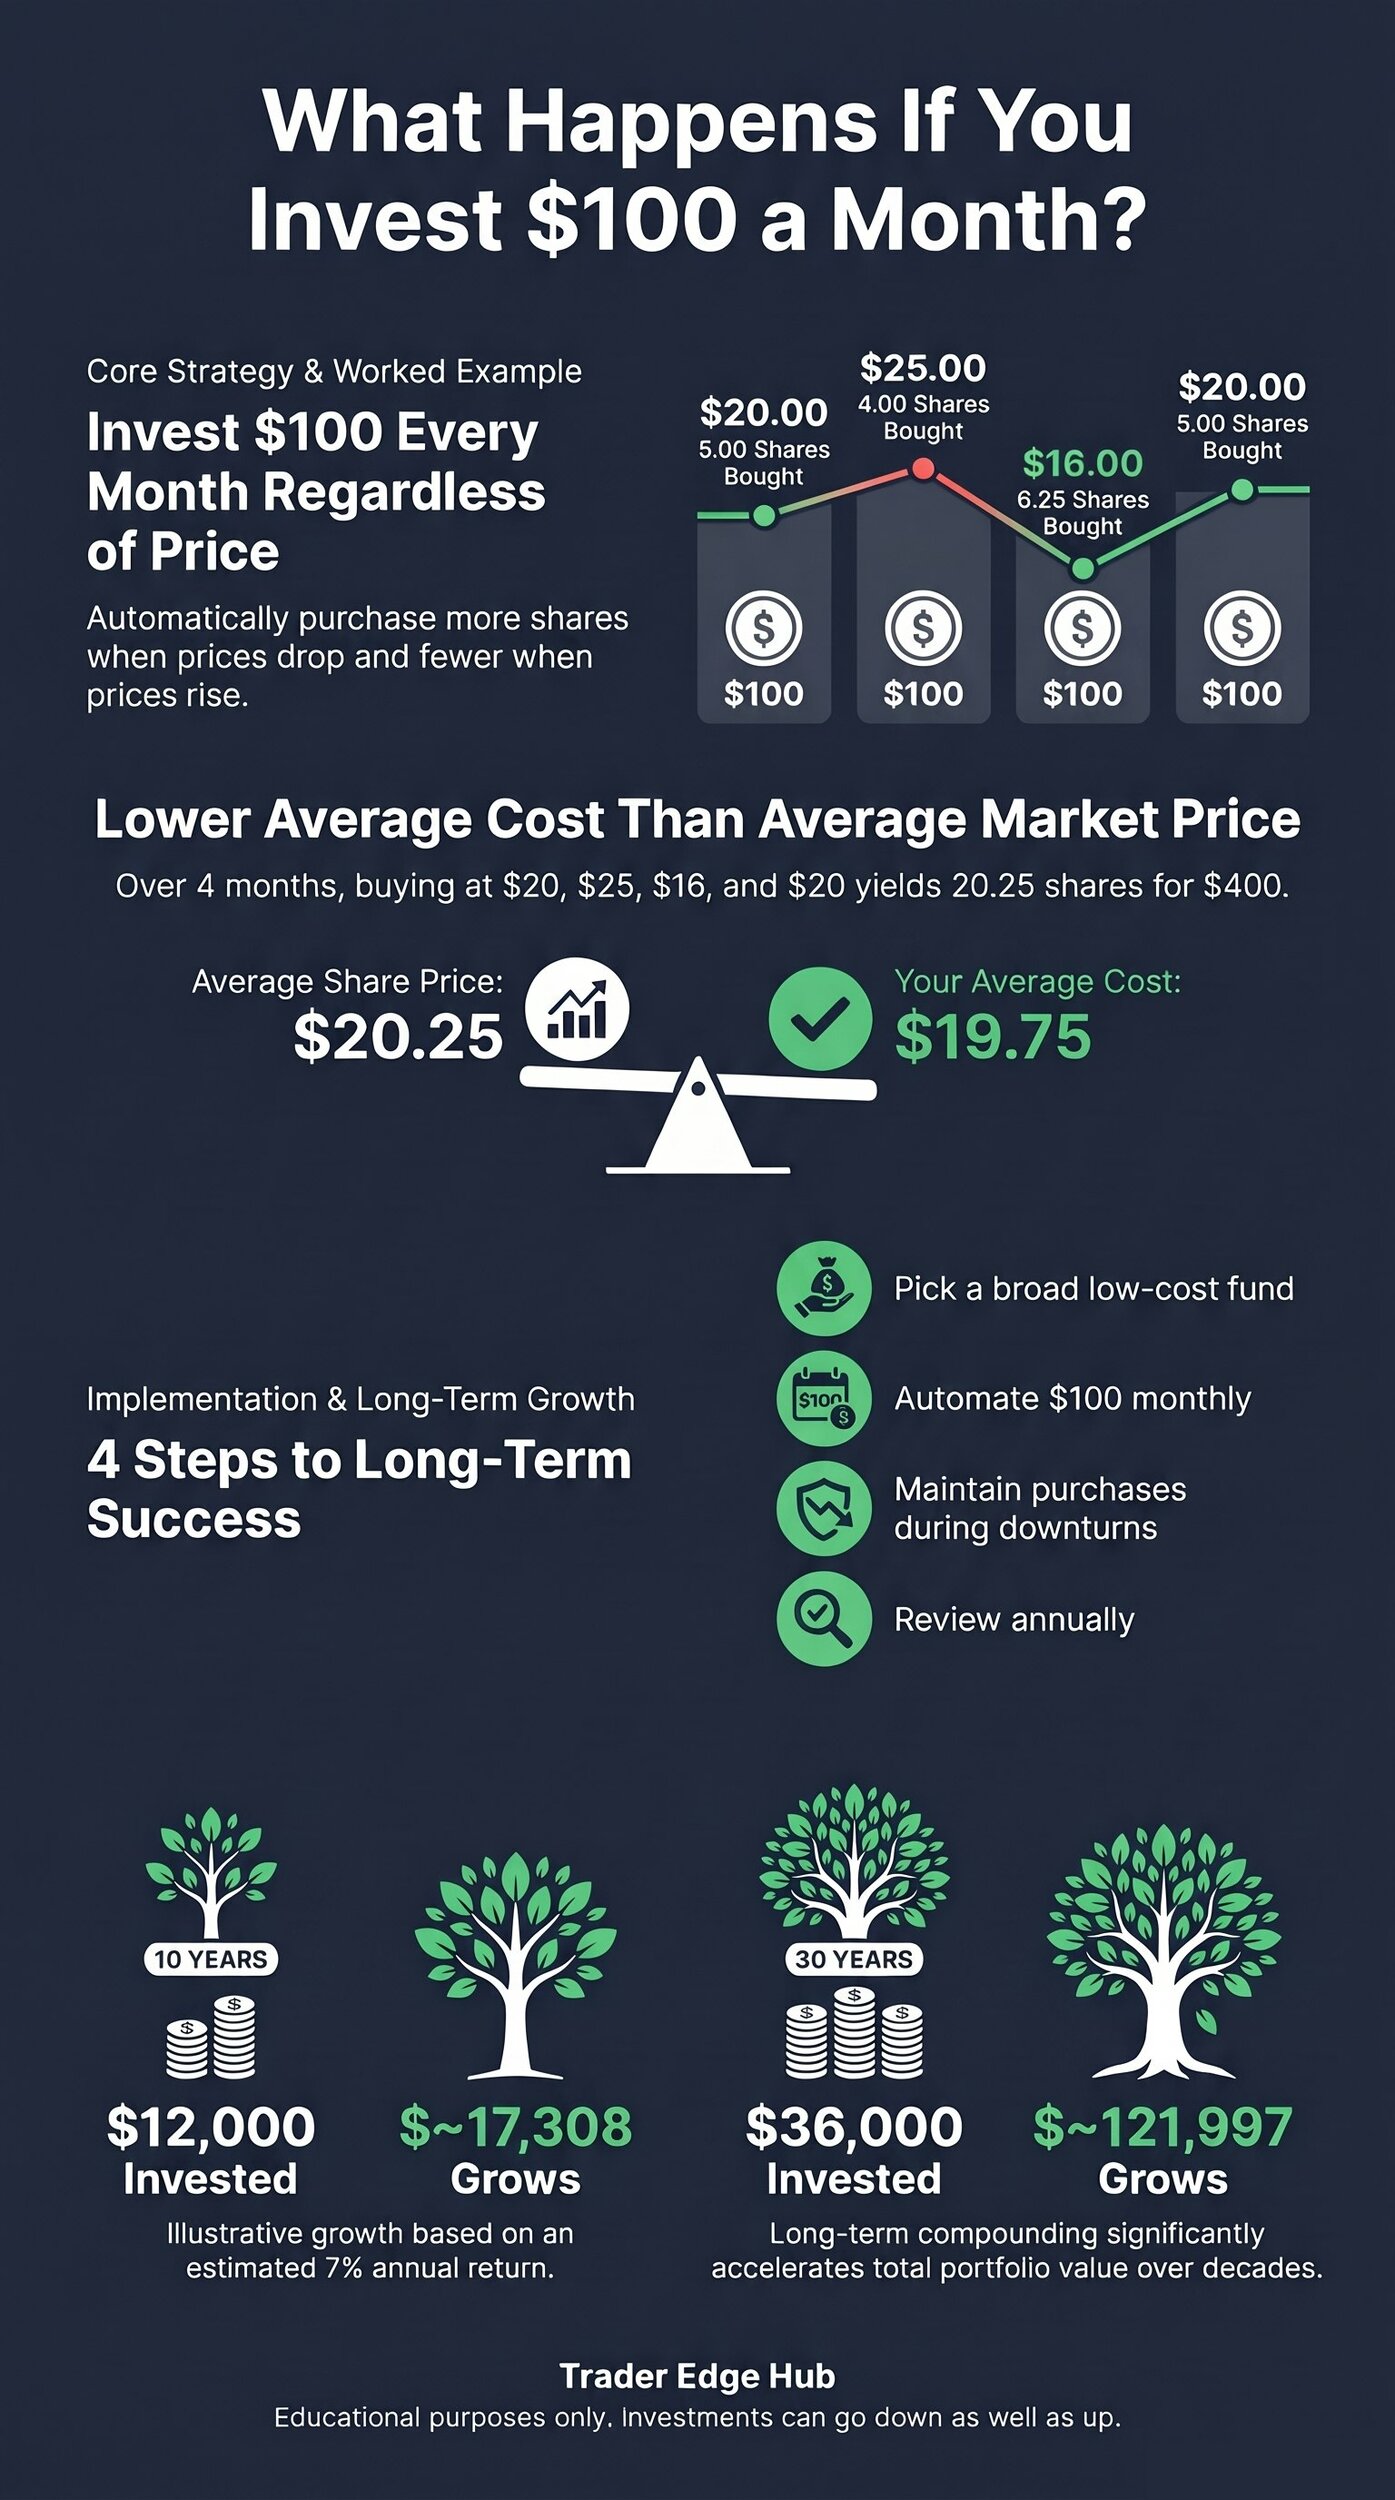
How does the same $100 buy more shares when prices fall?
To understand the mathematical advantage of fixed dollar deposits, consider a four-month investing scenario. According to Kennesaw State University research models, fixed contributions take advantage of price dips automatically. When share prices fall, your $100 monthly allocation buys a larger quantity of shares.
| Investment Month | Share Price | Monthly Cash Deposit | Shares Purchased | Cumulative Shares |
|---|---|---|---|---|
| Month 1 | $20.00 | $100.00 | 5.00 shares | 5.00 shares |
| Month 2 | $25.00 | $100.00 | 4.00 shares | 9.00 shares |
| Month 3 | $16.00 | $100.00 | 6.25 shares | 15.25 shares |
| Month 4 | $20.00 | $100.00 | 5.00 shares | 20.25 shares |
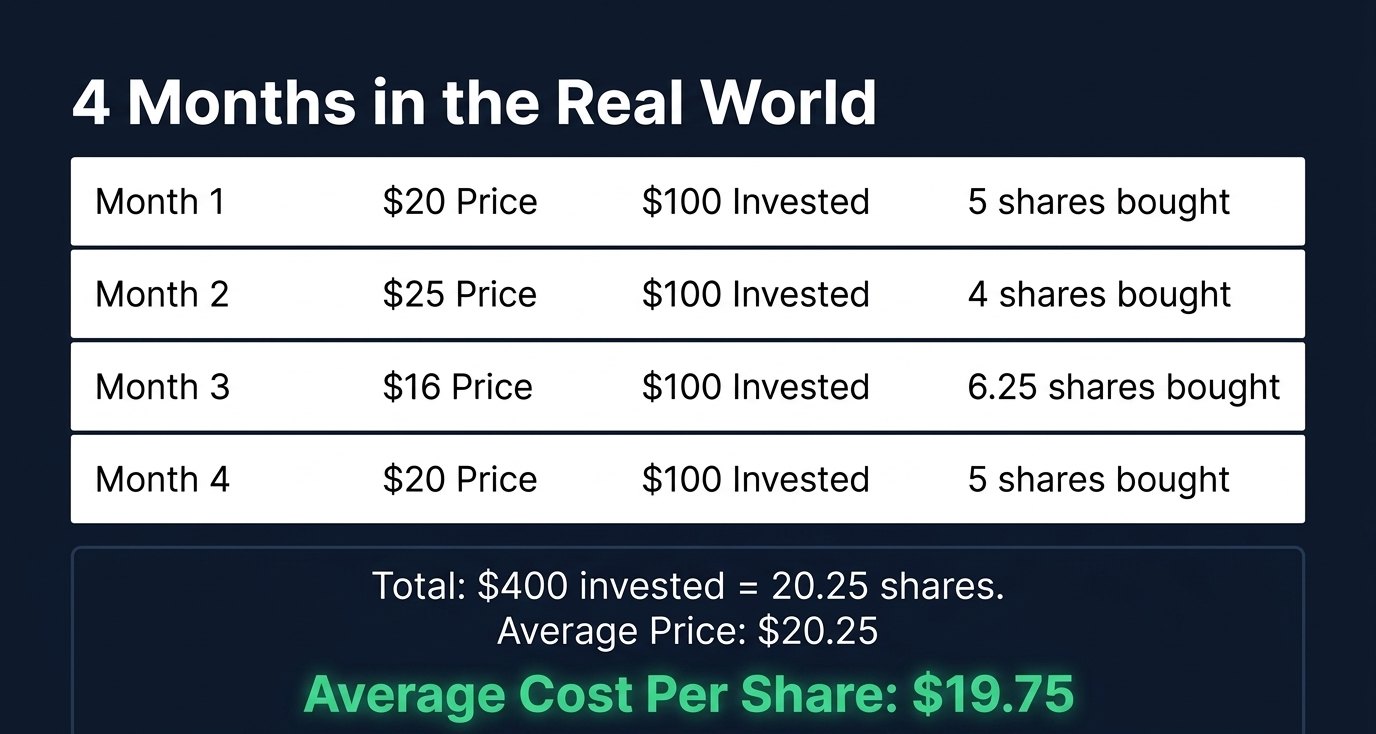
In this four-month example, you contribute a total of $400 out of pocket to purchase 20.25 shares. Dividing $400 by 20.25 shares results in an average cost of $19.75 per share. Meanwhile, the simple mathematical average of the share prices across the four months equals $20.25.
Your average purchase cost sits $0.50 below the simple average market price. According to Kennesaw State University research, this cost gap occurs because Month 3's price drop allowed your $100 deposit to acquire 6.25 shares. Lowering your average cost basis enhances your total portfolio gains when prices recover.
Pro tip: Enable automatic dividend reinvestment [DRIP] in your brokerage account. According to PortfolioGlance research, reinvesting index dividends adds roughly 1.3% to 2.0% in annual total returns over multi-decade holding periods.
What could $100 a month grow to over 10, 20 or 30 years?
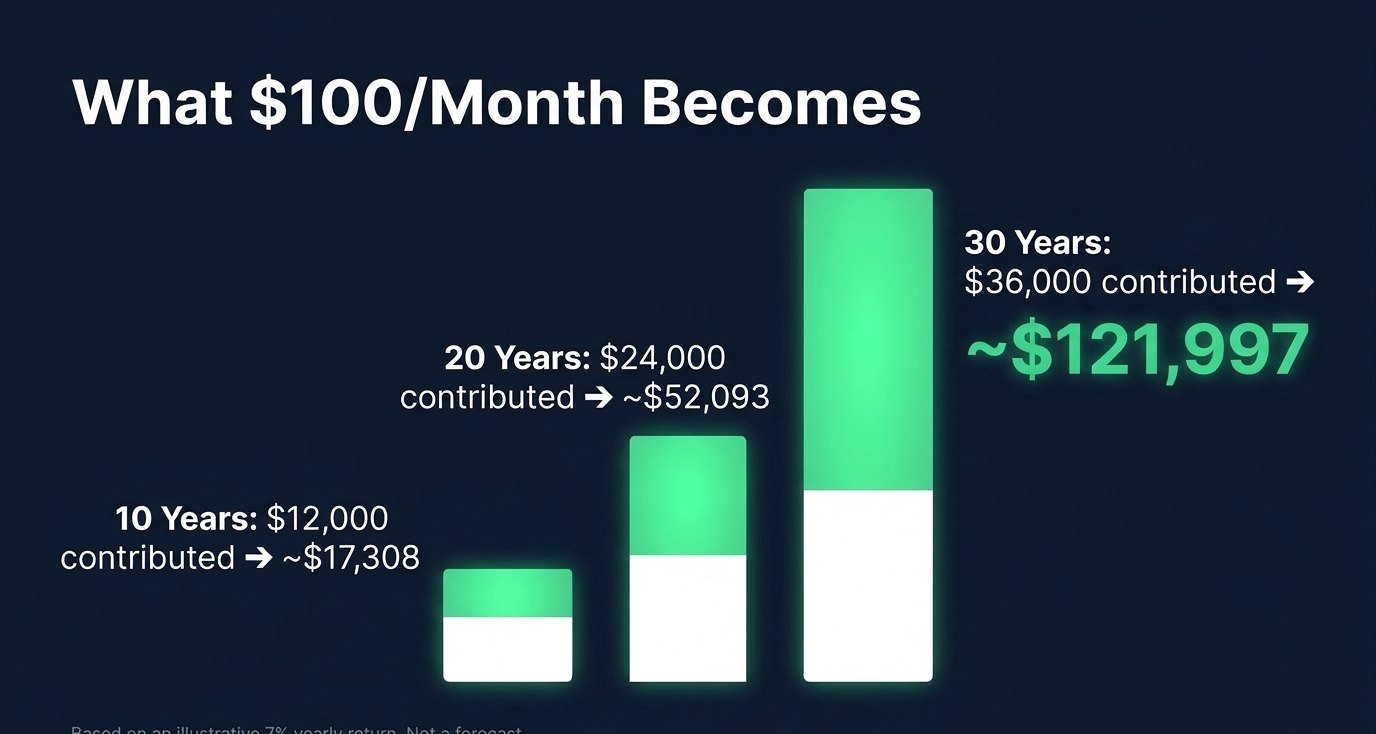
To evaluate long-term wealth building, we examine an illustrative compounding model for monthly $100 deposits. Assuming a 7% annualized return compounded monthly with end-of-month deposits, steady saving produces significant growth. Note that these calculations are illustrative examples rather than financial forecasts.
Over 10 years, your cash contributions total $12,000, and the portfolio balance reaches approximately $17,308. Over 20 years, total deposits reach $24,000, while compound growth expands the account to about $52,093. Over 30 years, $36,000 in total contributions grows to roughly $121,997 in inflation-adjusted purchasing power.
Without adjusting for inflation, nominal figures appear substantially higher. According to PortfolioGlance research, assuming a 10% nominal annual return expands a $100 monthly deposit to $226,048 over 30 years. Subtracting a typical 3% historical inflation rate leaves a 7% real return of $121,997 in spendable purchasing power.
Real market returns fluctuate significantly year to year and can remain negative during extended bear markets. According to S&P 500 Wikipedia historical data, the index has averaged an annualized compound return of 9.8% including dividends since 1926. Meanwhile, according to Motley Fool analysis, S&P 500 annual returns have ranged from plus 37.6% in 1995 to minus 37.0% in 2008.
Lump-sum investing outperforms spreading cash when you already hold a large windfall. According to Trader Markus data covering 38 years of S&P 500 returns, lump-sum investing beat 12-month DCA in 77% of tested 12-month periods. According to Vanguard 2012 research, lump-sum investing won in 67% of rolling 10-year periods due to long-term equity risk premiums.
Common mistake: Stopping monthly deposits during market declines is a frequent investor error. According to RBC Global Asset Management research, continuing dollar cost averaging during bear markets allows you to accumulate low-cost shares that drive eventual portfolio recovery.
How do you set up a $100-a-month plan?
Establishing an automated monthly investment framework requires four straightforward operational steps. According to Kennesaw State University guidelines, automating your savings process enforces disciplined investing habits. We outline how you can build a resilient low-maintenance account structure.
First, select a broad-based low-cost index ETF or mutual fund that tracks major market benchmarks. According to Dr Wealth research, core index funds charge low annual expense ratios below 0.09%. Broad market funds eliminate single-company default risk while providing immediate sector diversification.
Second, establish an automated recurring transfer from your checking account to your brokerage platform. According to Kennesaw State University research, scheduling transfers directly after payday prevents impulsive spending. You can set up scheduled automatic index buys using beginner-friendly brokerage apps (see the tools section below).
Third, maintain your monthly purchase schedule during volatile market drawdowns without trying to time dips. According to Trader Markus backtest research, waiting for market dips underperformed immediate regular investing in all 215 tested 20-year periods. Fourth, review your account asset allocation once a year to confirm your portfolio matches your risk tolerance.
You can analyze technical charts and track index volatility using free charting platforms. For additional portfolio management frameworks, read our guide on Position Sizing: The 1% Rule.
Is dollar cost averaging better than investing a lump sum?
Choosing between dollar cost averaging and lump-sum investing depends on market conditions and individual psychological risk tolerance. According to Vanguard 2012 research covering historical market data, lump-sum investing outperformed dollar cost averaging in roughly 67% of rolling 10-year periods. Equity markets generally trend upward over long timeframes, giving early lump-sum capital a compounding time advantage.
According to Trader Markus research analyzing 38 years of S&P 500 index returns, lump-sum investing beat 12-month dollar cost averaging in 77% of tested 12-month periods. Spreading cash over twelve months leaves funds idling in low-yield cash accounts while stock prices rise. However, lump-sum investing exposes your entire capital balance to immediate market timing risk.
According to Northwestern Mutual research, dollar cost averaging serves as an effective risk-reduction tool for new capital allocations. While lump-sum strategies maximize expected statistical returns in rising markets, dollar cost averaging minimizes emotional regret during sudden market crashes. At Trader Edge Hub, we recommend choosing a framework that prevents panic selling during market drawdowns.
| Investment Strategy | Historical Outperformance Rate | Primary Benefit | Primary Risk | Source Reference |
|---|---|---|---|---|
| Lump-Sum Investing | Outperforms in 67% to 77% of historical periods | Maximizes time in market for equity premiums | Exposes entire cash balance to immediate market peaks | Vanguard 2012 study & Trader Markus 38-year data |
| Dollar Cost Averaging | Outperforms during sustained market declines | Reduces emotional timing regret and entry volatility | Cash drag lowers total returns in bull markets | Northwestern Mutual research |
What does a worked example of $100 a month look like?
To evaluate compound growth mechanics, consider an investor contributing $100 at the end of each month. According to Investor.gov compound interest calculator models, compounding returns accelerate over extended multi-decade time horizons. Note that these calculations represent illustrative models rather than predictions of future financial outcomes.
The table below shows total contributions alongside accumulated growth assuming a 7% annual return compounded monthly. Over thirty years, a modest $100 monthly deposit accumulates significant wealth through compounding interest. You can learn how to structure portfolio allocations in our guide on Position Sizing: The 1% Rule.
| Time Horizon | Total Cash Contributed | Investment Growth Earned | Final Portfolio Value [7% Return] |
|---|---|---|---|
| 10 Years | $12,000.00 | about $5,308.00 | about $17,308.00 |
| 20 Years | $24,000.00 | about $28,093.00 | about $52,093.00 |
| 30 Years | $36,000.00 | about $85,997.00 | about $121,997.00 |
Annual expense ratios and advisory fees subtract directly from your gross compounding returns over time. According to Dr Wealth research, a 1% annual fee reduces a 7% gross return down to a 6% net return. The table below illustrates the long-term compounding cost of a 1% fee differential.
| Time Horizon | 7% Net Annual Return Value | 6% Net Annual Return Value | Cumulative Fee Impact Cost |
|---|---|---|---|
| 10 Years | about $17,308.00 | about $16,388.00 | about $920.00 lost to fees |
| 20 Years | about $52,093.00 | about $46,204.00 | about $5,889.00 lost to fees |
| 30 Years | about $121,997.00 | about $100,452.00 | about $21,545.00 lost to fees |
Over 30 years, a 1% annual fee gap reduces your final portfolio balance by about $21,545. According to Dr Wealth research, selecting low-cost funds ensures more capital remains invested to compound over time. To analyze fund fee structures before purchasing shares, review our guide on 10 Things to Check Before You Buy an ETF.
What are the most common dollar cost averaging mistakes?
Executing a monthly investment plan requires avoiding common behavioral and operational pitfalls. Based on institutional investor research, we identified six frequent errors retail investors make when executing dollar cost averaging plans.
- Stopping deposits during market drawdowns: Pausing monthly deposits during market drops destroys the core advantage of dollar cost averaging. According to RBC Global Asset Management research, buying shares during market declines lowers your average cost basis and accelerates recovery.
- Attempting to time market dips: Holding cash to wait for deeper market corrections reduces overall returns. According to Trader Markus backtest data, waiting for market dips underperformed steady recurring investing across all 215 tested 20-year periods.
- Selecting high-cost active funds: Paying high expense ratios eats away at long-term compounding. According to Dr Wealth research, high management fees consume tens of thousands of dollars in compounding potential over multi-decade periods.
- Abandoning plans during sideways markets: Investors often get bored when asset prices trade sideways for extended periods. According to FINRA guides, staying disciplined during flat markets allows you to accumulate shares that grow during subsequent bull rallies.
- Failing to automate monthly transfers: Manual deposits rely on willpower and invite emotional hesitation. According to Kennesaw State University research, manual execution leads to missed deposits and inconsistent portfolio growth.
- Ignoring asset allocation fit: Dollar cost averaging into a single speculative asset exposes your portfolio to concentrated default risk. According to Investor.gov documentation, spreading monthly deposits across broad index benchmarks preserves long-term portfolio balance.
Common mistake: Abandoning your regular contribution schedule when headline news predicts market declines is a major mistake. According to RBC Global Asset Management research, staying disciplined through market corrections remains essential for long-term compounding success.
Which tools help you automate $100 a month?
Modern fintech tools allow retail investors to set up automated recurring investment plans seamlessly. At Trader Edge Hub, we recommend using reputable trading platforms and regulatory calculators to streamline your monthly investing workflow.
To schedule automated recurring monthly buys and purchase fractional shares, consider using Robinhood. To chart long-term index price histories and track benchmark performance trends, explore TradingView. To analyze institutional factor scores and fund data using artificial intelligence, use Kavout.
In addition to private analytical platforms, use free official regulatory compound calculators. The SEC Investor.gov compound interest calculator allows you to model custom monthly deposits, interest rates, and time horizons. Furthermore, building emotional discipline helps you maintain long-term plans, as outlined in our guide on How to Build a Patient Trading Mind.
Pro tip: Align your recurring monthly investment transfer date with your regular payroll schedule. According to Kennesaw State University research, automating transfers directly after payday enforces disciplined saving habits before discretionary spending occurs.
Test yourself: dollar cost averaging quiz
1. How does dollar cost averaging lower your average share purchase cost over time?
A) It eliminates management fees charged by fund issuers
B) Fixed dollar deposits buy more shares when prices are low and fewer when high
C) Brokerages grant cash discounts on recurring orders
D) It produces positive monthly returns regardless of market conditions
Answer: B. Fixed dollar amounts automatically purchase a higher share volume during market price dips.
2. According to historical market studies, how does lump-sum investing compare to dollar cost averaging?
A) Dollar cost averaging outperformed lump-sum investing in 90% of historical periods
B) Lump-sum investing outperformed dollar cost averaging in roughly 67% to 77% of tested periods
C) Both strategies produce identical financial returns over ten years
D) Lump-sum investing is only suitable for fixed-income bond portfolios
Answer: B. According to Vanguard 2012 and Trader Markus research, lump-sum investing outperformed in most historical periods due to equity market growth trends.
3. What is the main psychological benefit of dollar cost averaging for new investors?
A) It promises complete protection against market declines
B) It eliminates the need to pay annual taxes on capital gains
C) It reduces market timing anxiety and emotional regret during drawdowns
D) It yields higher returns than individual stock picking
Answer: C. Spreading deposits over time removes emotional stress and prevents making large purchases right before market tops.
4. How much does a 1% annual fee reduce a $100 monthly investment returning 7% over 30 years?
A) About $500 in total accumulated value
B) About $2,500 in total accumulated value
C) About $21,545 in total accumulated value
D) About $50,000 in total accumulated value
Answer: C. According to Dr Wealth research, a 1% fee reduces a 30-year 7% portfolio from $121,997 down to $100,452.
5. What happens when an investor stops monthly deposits during a market correction?
A) Portfolio returns increase automatically
B) The investor misses the opportunity to accumulate discounted shares that drive recovery
C) Brokerage accounts charge extra maintenance penalties
D) Fund managers convert existing shares into cash
Answer: B. According to RBC Global Asset Management research, pausing deposits during downturns prevents accumulating discounted shares needed for portfolio recovery.
FAQ
Is dollar cost averaging suitable for beginners?
Yes, dollar cost averaging provides a straightforward framework for beginner investors. According to Kennesaw State University research, investing fixed monthly sums removes emotional market timing decisions. Automating deposits helps new investors build disciplined long-term wealth habits.
What is the best frequency for dollar cost averaging?
Monthly contributions align best with standard monthly payroll and budgeting cycles. According to Trader Markus backtest research, performance differences between weekly and monthly DCA schedules are negligible. Consistency matters far more than choosing a specific deposit frequency.
Should you use dollar cost averaging in a tax-advantaged account?
Executing dollar cost averaging inside tax-advantaged accounts like IRAs or 401(k)s maximizes compounding efficiency. According to FINRA investor guides, tax-deferred growth prevents annual dividend taxes from reducing compound gains. You can learn how fixed income fits into accounts in our guide on Bonds Explained for Stock Investors.
Can dollar cost averaging prevent investment losses?
No, dollar cost averaging does not protect your portfolio against overall market declines. According to Investor.gov documentation, if an asset declines continuously, dollar cost averaging will still incur paper losses. Selecting broad market index benchmarks helps mitigate single-stock failure risks.
How does dollar cost averaging differ from value averaging?
Dollar cost averaging invests a fixed dollar amount regardless of account value movements. Value averaging adjusts monthly deposit amounts up or down to hit specific account target figures. According to Kennesaw State University research, dollar cost averaging remains far simpler to automate.
What should you do with a large cash lump sum?
If you hold a large cash windfall, financial research favors immediate lump-sum investing. According to Vanguard 2012 research, lump-sum allocations outperformed DCA in 67% of rolling 10-year periods. However, if market timing causes anxiety, spreading deposits over six to twelve months reduces emotional stress.
The verdict
Investing $100 a month through dollar cost averaging builds substantial long-term wealth while minimizing emotional stress. By automating your contributions into low-cost broad index funds, you harness the power of compounding without predicting market tops or bottoms. Take your next step today by setting up an automated recurring monthly transfer in your brokerage account.
Sources: Investor.gov dollar cost averaging guide, FINRA investor bulletin, Vanguard 2012 lump sum study, Trader Markus 38-year S&P 500 study, Northwestern Mutual research, PortfolioGlance 30-year S&P 500 study, The Motley Fool S&P 500 return analysis, S&P 500 Wikipedia historical data, Kennesaw State University DCA research, RBC Global Asset Management DCA report, Dr Wealth expense ratio study.
Investments can go down as well as up, and you may get back less than you put in. Past performance does not guarantee future results. Check local tax rules. This article is education, not financial advice.
Further reading: For the case for steady, low-cost index investing from the founder of Vanguard, John Bogle's The Little Book of Common Sense Investing explains why keeping fees low and staying invested matters over decades. Check the current price on Amazon.
As an Amazon Associate, Trader Edge Hub earns from qualifying purchases.