

- What does it really cost to own a home each month?
- What costs do you never get back when you buy or rent?
- How do 7% mortgage rates change the math?
- What is the price-to-rent ratio and how do you use it?
- How do you run your own rent vs buy numbers in 5 steps?
- When does buying beat renting?
- What does a 5-year rent vs buy comparison look like in numbers?
- What common mistakes do buyers and renters make?
- Which tools help you evaluate rent vs buy options?
- Test yourself
- FAQ
- Is renting always wasting money compared to buying?
- How long do you need to stay in a home to break even?
- How do mortgage rate changes affect total ownership costs?
- Can you deduct home mortgage interest on your tax return?
- What happens if home appreciation rates slow down?
- Should you invest your monthly rental savings in stocks?
- The verdict
Buying a home or investing involves risk. Money can be locked up and lost, and costs such as repairs, vacancies, fees and rate changes can be higher than expected. Past performance does not guarantee future results, and local tax rules vary. This article is education, not financial advice.
Disclosure: this article contains affiliate links. If you sign up through them, Trader Edge Hub may earn a commission at no extra cost to you. We only mention tools we think fit the topic.
Choosing between buying a property and renting depends on calculations. You can evaluate options using a rent vs buy calculator to compare total housing expenses. At Trader Edge Hub, we track national real estate data to help your decision. According to Freddie Mac's Primary Mortgage Market Survey on October 29, 2026, average 30-year fixed rates reached 7.24%.
High borrowing costs have significantly altered housing affordability. A March 2026 Realtor.com report showed renting is cheaper than buying in all 50 major US metros. Furthermore, Zillow's 2026 forecast indicated renting saves typical households over $12,000 annually. Examine monthly expenditures to find the right path.
Quick answer: At a 7.24% mortgage rate from Freddie Mac on October 29, 2026, buying a $400,000 home requires approximately $3,006 in monthly outflows. Renting a comparable home for $2,000 a month saves substantial cash. Over a 5-year hold, renting saves $35,290 after accounting for stock market opportunity costs, according to CapRateCity models.
What does it really cost to own a home each month?
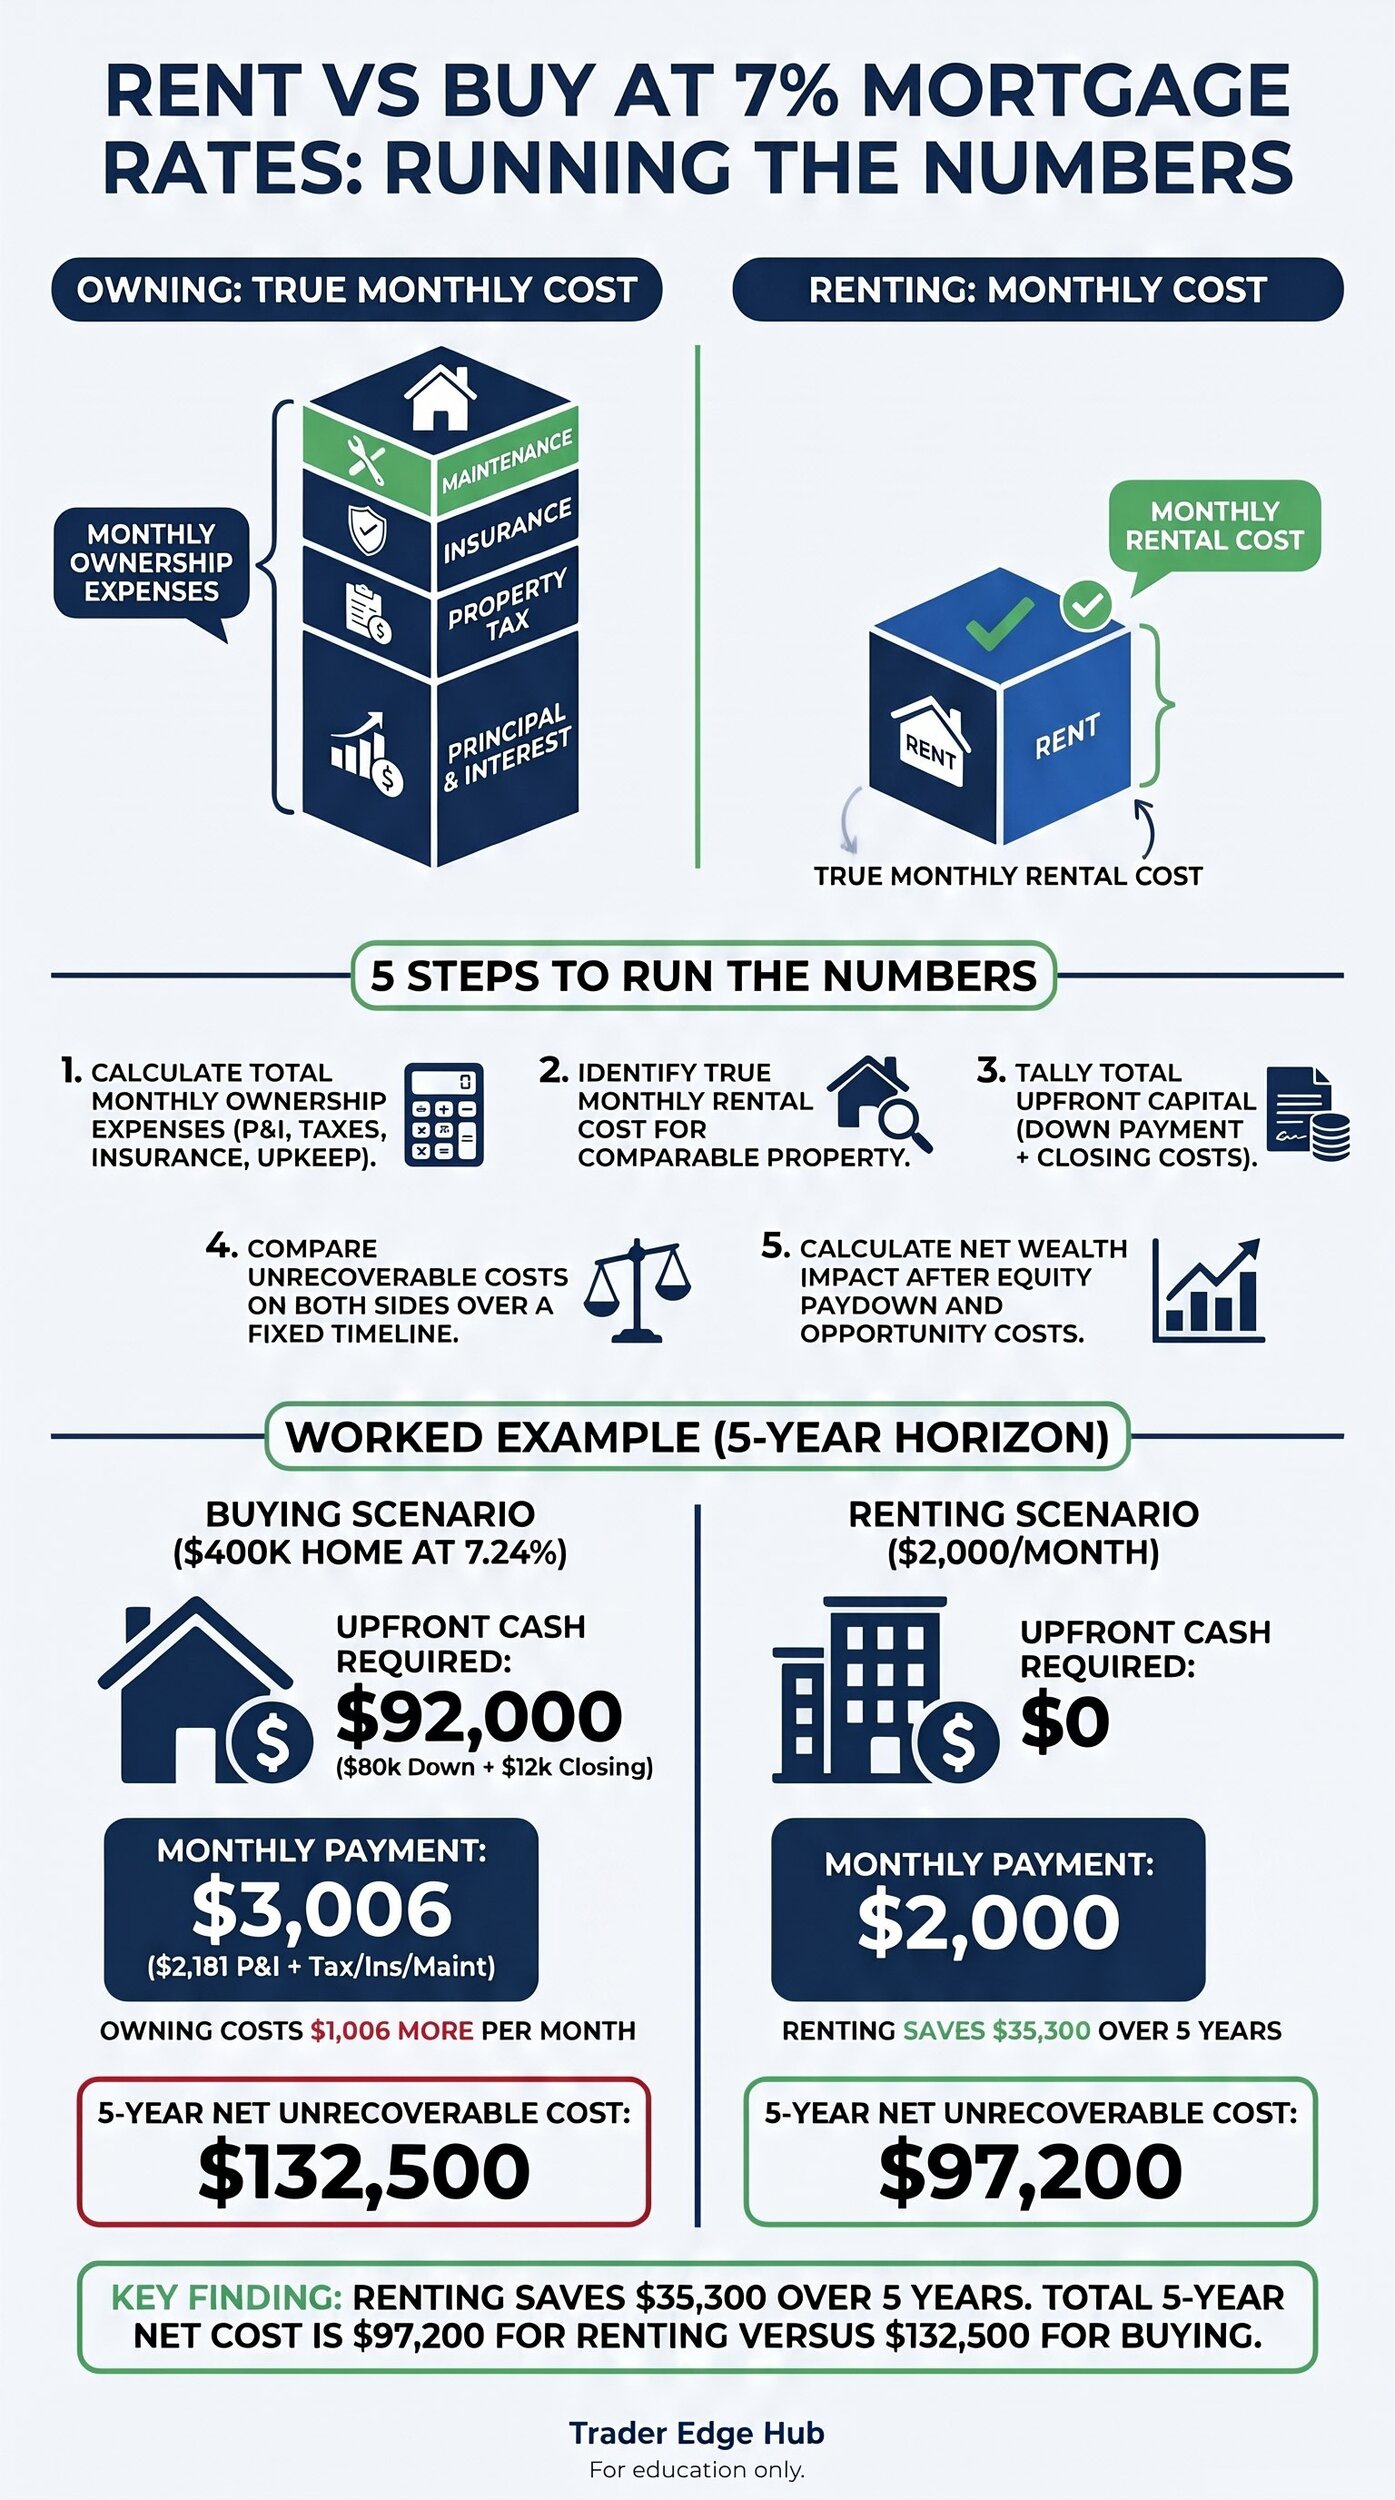
Purchasing a house involves several distinct monthly costs. The largest component is principal and interest [core loan repayment and borrowing costs]. On a $320,000 mortgage loan at 7.24% interest, your monthly principal and interest payment equals $2,180.79. This calculation relies on Freddie Mac survey data from October 29, 2026.
Homeowners must also cover property taxes and insurance premiums. An October 22, 2026 Zillow/Thumbtack study revealed hidden ownership costs top $16,566 yearly. In that study, taxes and insurance drove substantial annual payments. CapRateCity benchmarks estimate typical annual property taxes at 1.1% of home value and annual insurance around $1,500.
Upkeep and homeowner association fees add recurring obligations. Big Mike Grant's October 2026 guidelines suggest setting aside 1.0% of home value annually for repairs. For a $400,000 property, maintenance costs add $333.33 every month. If your home includes homeowner association fees [monthly dues], add those directly to your budget.
| Monthly Expense Component | Estimated Monthly Amount ($400k Home) | Supporting Source |
|---|---|---|
| Principal & Interest (7.24%) | $2,180.79 | Freddie Mac PMMS (Oct 29, 2026) |
| Property Taxes (1.1%/yr) | $366.67 | CapRateCity Calculator Model |
| Homeowners Insurance | $125.00 | CapRateCity Calculator Model |
| Maintenance Allocation (1.0%/yr) | $333.33 | Big Mike Grant (Oct 2026) |
| Total Monthly Outflow | $3,005.79 | Trader Edge Hub Analysis |
What costs do you never get back when you buy or rent?
To evaluate housing accurately, we must separate equity building from unrecoverable costs [money spent that generates no financial return]. When renting, your entire monthly payment is unrecoverable. Buying also involves major unrecoverable expenses.
Unrecoverable buying costs include mortgage interest, property taxes, insurance, and ongoing maintenance. Upfront closing costs range between 2% and 5% of purchase price (2026 Closing Costs Guide). When selling, broker fees consume 7% of property value (CapRateCity metrics).
For renters, unrecoverable costs include lease payments plus foregone investment returns [return lost tying up capital]. Zillow Research (2026) highlighted that foregone stock returns on down payments strongly impact net worth. CapRateCity models assume a 7.0% nominal annual stock return on down payment capital.
Common mistake: Assuming rent is completely wasted while mortgage payments build pure equity. Early in a 30-year mortgage at 7.24%, interest, taxes, insurance, and upkeep represent unrecoverable costs that often exceed total monthly rent.
How do 7% mortgage rates change the math?
Interest rates fundamentally dictate how fast you build home equity. When rates rise from 3% to over 7%, amortization shifts toward bank interest. Bankrate historical data shows rates climbing from 2021 lows near 3% to over 7% by 2026.
On a $320,000 mortgage loan at 7.24% (Freddie Mac PMMS, Oct 29, 2026), your total payment is $2,180.79 monthly. In month 1, exactly $1,930.67 covers interest charges, while only $250.12 reduces loan principal. Over five years, you pay $112,828 in total interest and reduce principal by $18,019, based on CapRateCity models.
Tax deductions offset a portion of interest expense. According to IRS Publication 936 (2025), mortgage interest is deductible on loan balances up to $750,000 for itemized returns. However, CapRateCity notes that high standard deduction limits mean many homeowners do not itemize.
Pro tip: Model your mortgage amortization carefully before buying at 7% interest. Run your loan through an amortization schedule (a month-by-month table of interest and principal) and check how much of each payment is interest in the first five years.
What is the price-to-rent ratio and how do you use it?
The price-to-rent ratio [a metric comparing home prices to annual rental rates] serves as a quick screening tool for real estate markets. Calculate this metric by dividing home price by 12 months of rent. A 2026 report by Lofty AI explains how investors and homebuyers use this ratio to gauge local valuation.
Lofty AI benchmarks show a ratio of 15 or below indicates buying is cost-effective. A ratio between 16 and 20 marks a neutral zone requiring deeper calculation. Ratios of 21 or higher signal markets where leasing costs less than ownership.
Recent market conditions have pushed price-to-rent ratios higher across major American cities. A March 2026 Realtor.com report confirmed that high home prices keep buying premiums elevated. You should always combine the price-to-rent ratio with a full rent vs buy calculator before signing a purchase contract.
How do you run your own rent vs buy numbers in 5 steps?
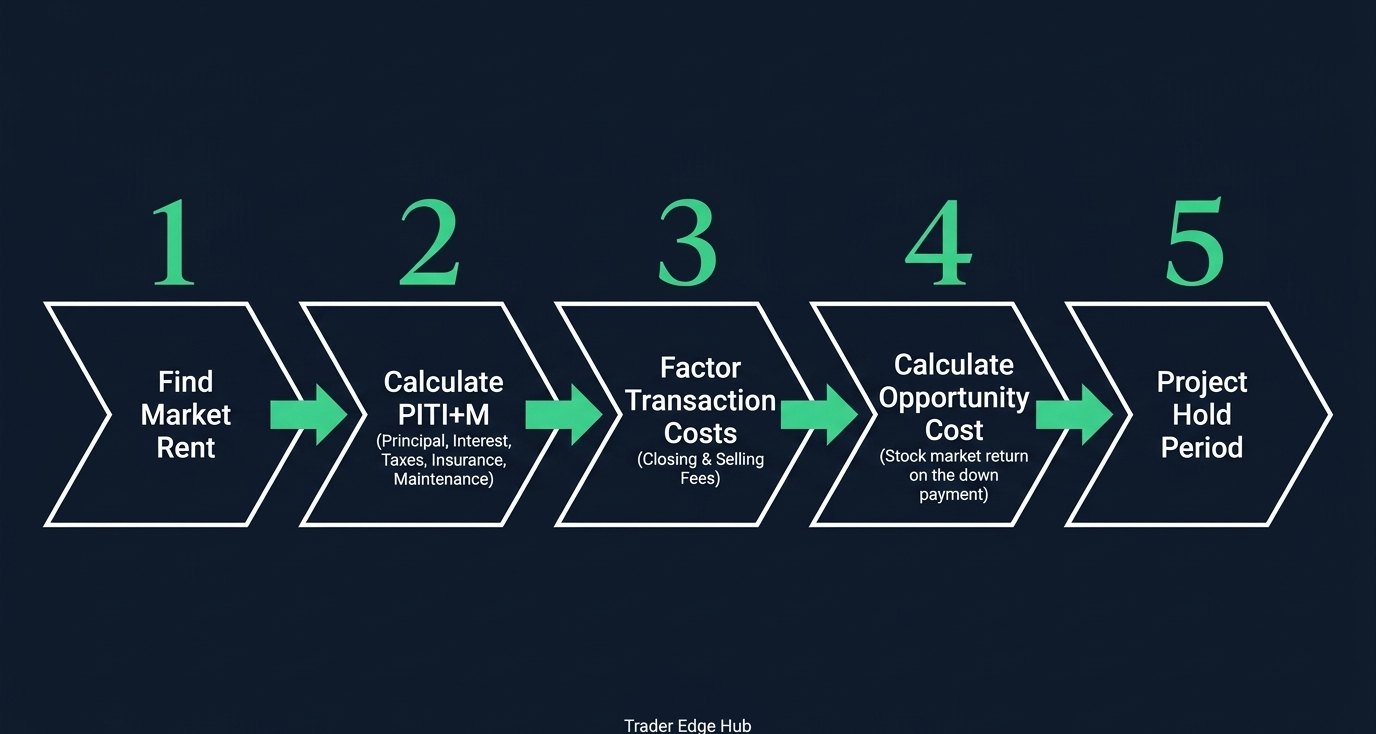
Trader Edge Hub recommends a 5-step framework to evaluate housing economics. Following these steps lets you compare listings without emotional assumptions. CapRateCity models support this methodology for long-term planning.
First, identify home price, down payment, and loan terms using Freddie Mac PMMS rates. Second, calculate total monthly ownership costs, including taxes, insurance, maintenance, and fees. Third, determine comparable monthly rent and account for annual rent increases, supported by RealWealth historical data.
Fourth, compute the opportunity cost of investing your down payment and closing costs in equities. Fifth, project total net costs over your intended holding period to find your financial break-even point. Zillow Research reports show national holding breakeven points typically range between 5 and 8 years.
| Step Number | Evaluation Action | Key Inputs & Sources |
|---|---|---|
| Step 1 | Determine Loan Baseline | Home price, down payment, Freddie Mac rate (7.24%) |
| Step 2 | Tally Monthly Outflow | P&I, taxes, insurance, maintenance (Oct 2026 study) |
| Step 3 | Project Rent Escalation | Initial rent, 3.5% escalation (CapRateCity / RealWealth) |
| Step 4 | Factor Opportunity Cost | Stock return on upfront cash (CapRateCity model) |
| Step 5 | Compare Net Holding Cost | Net equity vs renter savings (Zillow Research) |
When does buying beat renting?
Determining when buying beats renting depends on your holding period [years lived in the home]. Upfront acquisition fees create a financial hurdle for home buyers. According to Zillow Research, national homeownership typically takes six years to surpass renting in value.
CapRateCity financial models show that break-even horizons usually range between five and eight years. When you stay in a home longer, high transaction fees get spread over more years. Furthermore, monthly principal payments gradually reduce loan balances over time. Learn about compounding in our guide on what happens if you invest $100 a month with dollar-cost averaging.
Several key variables can shift this break-even timeline in favor of homeownership. Lower mortgage interest rates reduce monthly interest charges significantly. Faster home price appreciation builds equity more quickly for property owners. Additionally, rapid rent increases make leasing relatively more expensive each year, according to RealWealth market data.
Conversely, strong financial market returns favor renters who invest their saved capital. CapRateCity models assume a 7.0% nominal annual stock return on down payment capital. To invest extra cash effectively, read our primer on how to build a simple 3-ETF portfolio.
What does a 5-year rent vs buy comparison look like in numbers?
At Trader Edge Hub, we evaluate housing decisions using exact mathematical models. Below is a 5-year comparison for a $400,000 property. This model assumes a 7.24% mortgage rate from Freddie Mac PMMS on October 29, 2026. Every assumption draws directly from verified housing data sources.
| Financial Component | Home Buying Option ($400,000 Price) | Home Renting Option ($2,000 Initial Rent) | Supporting Source & Notes |
|---|---|---|---|
| Upfront Cash Outlay | $80,000 down payment (20%) + $12,000 closing costs (3%) = $92,000.00 | $92,000.00 initial capital invested in stock market | CapRateCity model & 2026 Closing Costs Guide |
| Loan Terms & Rate | $320,000 loan balance at 7.24% interest for 30 years | N/A (No mortgage debt) | Freddie Mac PMMS (Oct 29, 2026) |
| Monthly Outflow Breakdown | P&I $2,180.79 + Tax $366.67 + Ins. $125.00 + Maint. $333.33 = $3,005.79/mo | $2,000.00 initial monthly rent (3.5% annual escalation) | CapRateCity & Big Mike Grant (Oct 2026) |
| Total 60-Month Housing Payments | $180,347.64 total PITI plus maintenance over 5 years | $128,699.18 cumulative rent paid over 5 years | CapRateCity & RealWealth projection |
| Year 5 Property Value & Balance | $475,074.52 home value (3.5% appreciation); $301,980.97 loan balance | N/A (No property owned) | CapRateCity Case-Shiller baseline model |
| Selling Transaction Expenses | $33,255.22 selling costs (7% of $475,074.52 home value) | N/A (No sale costs) | CapRateCity selling expense standard |
| Net Equity Recovered at Year 5 | $139,838.33 net equity ($475,074.52 - $301,980.97 - $33,255.22) | N/A (No real estate equity) | CapRateCity amortization formula |
| Investment Returns & Tax | N/A (Upfront capital committed to down payment) | $92,000 grows to $129,034.76 at 7%; $37,034.76 gain minus 15% tax = $31,479.55 net gain | CapRateCity opportunity cost model |
| Net 5-Year Total Financial Cost | $132,509.31 ($92,000 + $180,347.64 - $139,838.33) | $97,219.63 ($128,699.18 rent paid - $31,479.55 net gain) | Trader Edge Hub synthesis |
| Financial Cost Difference | Buying costs $35,289.68 more net cash over 5 years | Renting is $35,289.68 cheaper over 5 years | CapRateCity comparative output |
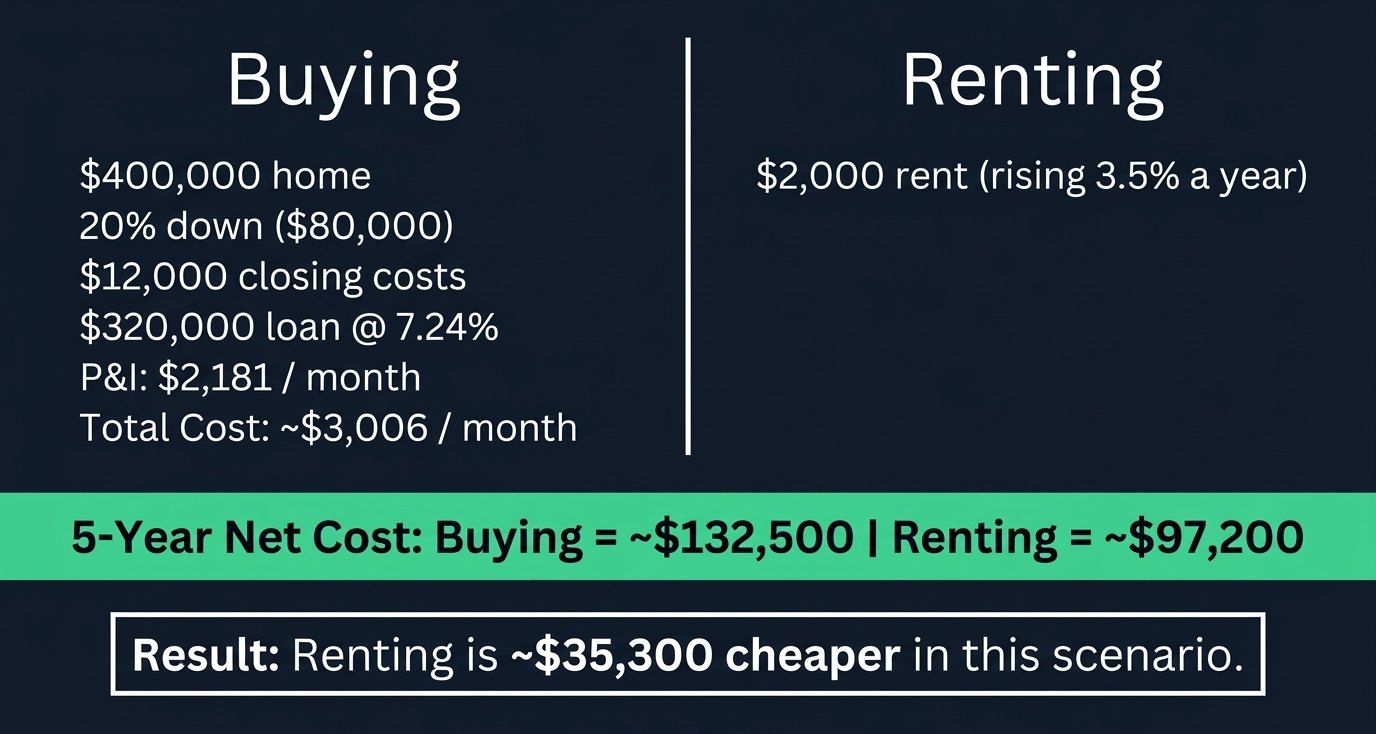
In this scenario, renting delivers $35,289.68 in total net savings over five years. This model is conservative for renting because it excludes reinvestment of monthly cash savings. In year one, the renter saves $1,005.79 monthly in lower housing payments. If the renter invested those savings, total rental wealth would expand further.
All calculations in this worked example serve as illustrative models. Actual housing expenses depend on local tax assessments and regional market trends. You should adjust these figures using local listing data before making financial commitments.
What common mistakes do buyers and renters make?
Many households make costly errors when comparing housing alternatives. Below are six common miscalculations that distort decisions.
1. Ignoring ongoing maintenance and hidden fees: Many buyers focus solely on principal and interest payments. According to the October 22, 2026 Zillow/Thumbtack study, hidden ownership costs top $16,566 annually. Forgetting routine repairs and property tax hikes creates budget strain.
2. Underestimating transaction costs: Closing fees add 2% to 5% at purchase, according to the 2026 Closing Costs Guide. Furthermore, CapRateCity models factor a 7% selling cost upon departure. Short holding periods often fail to recover these transaction expenses.
3. Overlooking down payment opportunity costs: Tying up $80,000 in equity prevents those funds from earning market returns. A 2026 study by Zillow Research emphasized that capital returns heavily influence renter net worth. Ignoring foregone investment gains creates an inaccurate comparison.
4. Assuming property values always appreciate rapidly: Real estate markets experience periods of stagnation or declining values, as shown in historical housing index data. Assuming strong annual growth can lead to overpaying for real estate. Historical market trends show that appreciation varies significantly across geographic regions.
5. Forgetting annual rent inflation: Renters sometimes assume lease rates remain constant indefinitely. RealWealth market reports indicate that annual rent growth averages around 3.5%. Compounding rent increases make long-term leasing costs higher over extended periods.
6. Overestimating tax deduction benefits: Buyers often expect large tax breaks from mortgage interest payments. According to IRS Publication 936 (2025), tax deductions require itemizing expenses on federal tax filings. High standard deductions prevent many homeowners from claiming interest savings.
Which tools help you evaluate rent vs buy options?
Selecting the right financial platforms simplifies your wealth management. If you decide to rent and invest your surplus down payment cash, brokerage tools become essential. You can open an investment account with Robinhood to invest capital in low-cost index funds.
Before purchasing equities, evaluate fund holdings carefully. Review our guide on 10 things to check before you buy an ETF to build a portfolio. Stock market investments allow renters to build liquid wealth without property management headaches.
For advanced market research, software intelligence tools provide valuable insights. You can analyze market trends using Kavout data solutions. Understanding asset price movements helps you balance real estate and stock allocations effectively.
When evaluating fixed-income markets, understanding interest rates is critical. Read our guide on why bond prices fall when interest rates rise to understand monetary shifts. Bankrate historical reports demonstrate how rate cycles influence borrowing costs.
Test yourself
1. What shifts the break-even point over time?
A) Stock volatility
B) Spreading transaction costs over a longer holding period
C) Interior repainting
D) Waiving survey fees
Answer: B. Spreading upfront closing and selling costs over a longer holding period allows equity accumulation to surpass initial fees.
2. What was Freddie Mac 30-year rate on Oct 29, 2026?
A) 5.50%
B) 6.10%
C) 7.24%
D) 8.15%
Answer: C. Freddie Mac reported an average 30-year fixed rate of 7.24% on October 29, 2026.
3. How much early mortgage payment goes to interest at 7.24%?
A) Under 20%
B) 50%
C) Over 85%
D) 100%
Answer: C. At 7.24% interest, interest consumes over 85% of early monthly loan payments according to CapRateCity amortization models.
4. How large are selling costs in CapRateCity models?
A) 1%
B) 3%
C) 7%
D) 15%
Answer: C. CapRateCity models set selling transaction costs at 7% to cover broker commissions and administrative fees.
5. Why is foregone stock return an unrecoverable cost?
A) Down payment capital in real estate cannot earn stock returns
B) Lenders charge interest penalties on down payments
C) Insurance mandates stock hedges
D) Taxes must be paid to brokerages
Answer: A. Tying up capital in a home down payment creates an opportunity cost by preventing stock market compounding.
FAQ
Is renting always wasting money compared to buying?
No, renting is not inherently wasting money. Monthly rent provides shelter without exposure to repair liabilities, property taxes, or market devaluation risks. A March 2026 Realtor.com report confirmed that renting saves cash monthly across all 50 major US markets.
How long do you need to stay in a home to break even?
Most households must remain in a home for five to eight years to break even financially. Zillow Research indicates that national homeownership generally surpasses renting after six years. Staying less time often results in losses due to transaction costs.
How do mortgage rate changes affect total ownership costs?
Higher mortgage rates increase total borrowing costs and reduce monthly principal paydown. Bankrate historical data shows that rising rates push monthly mortgage payments substantially higher. A 7.24% rate from Freddie Mac on October 29, 2026 makes borrowing significantly more expensive.
Can you deduct home mortgage interest on your tax return?
Taxpayers can deduct mortgage interest if they itemize tax deductions on federal filings. IRS Publication 936 (2025) specifies that interest is deductible on loan balances up to $750,000. However, high standard deductions mean many buyers receive limited net tax relief.
What happens if home appreciation rates slow down?
Slower home appreciation extends the time required to break even on a home purchase. CapRateCity models demonstrate that lower appreciation reduces net equity recovered at sale. When home price growth stalls, renting often becomes the superior financial choice over 5-year periods.
Should you invest your monthly rental savings in stocks?
Investing monthly rental savings significantly enhances total wealth for tenants. Empower housing reports highlight that investing cash differences turns leasing into a potent wealth-building strategy. CapRateCity models show that compounding investment returns can outperform real estate equity growth.
The verdict
At current interest rates, renting provides a clear financial advantage over short holding periods. With Freddie Mac reporting 30-year fixed rates at 7.24% on October 29, 2026, homeownership costs exceed rental payments across most markets. CapRateCity models show that renting saves $35,290 over five years under current market parameters.
Your immediate next step is calculating your personal break-even horizon using local data. Gather your current rent, target home price, and down payment savings. Run these numbers through a rent vs buy calculator to decide confidently.
Sources: Freddie Mac Primary Mortgage Market Survey (Oct 29, 2026), Zillow Research, Realtor.com March 2026 Rental Report, CapRateCity Rent vs Buy Model, Bankrate Mortgage Rate History, IRS Publication 936 (2025), Lofty AI 2026 Report, Zillow/Thumbtack Oct 22, 2026 Hidden Costs Study, Big Mike Grant (Oct 2026).
Buying a home or investing involves risk. Money can be locked up and lost, and costs such as repairs, vacancies, fees and rate changes can be higher than expected. Past performance does not guarantee future results, and local tax rules vary. This article is education, not financial advice.