
- What does it mean to analyze a rental property?
- What is net operating income (NOI) and how do you calculate it?
- What is a cap rate and what counts as a good one?
- What is cash flow and why does it matter more than rent?
- What is cash-on-cash return?
- What does the 1% rule say and where does it fail?
- How do you analyze a rental property step by step?
- What does a worked example look like in numbers?
- What changes if rent drops or interest rates rise?
- What common mistakes do property investors make?
- Which tools help you analyze rental properties?
- Test yourself
- FAQ
- Why is net operating income calculated before mortgage payments?
- What is a good cash-on-cash return for a rental property?
- How does vacancy affect rental cash flow?
- What operating expense percentage should you assume?
- Does passing the 1% rule ensure positive cash flow?
- How do higher mortgage rates impact cash-on-cash return?
- The verdict
Real estate investing involves substantial risk. Money can be locked up and lost, and examples include vacancies, repairs and fees. This article is education, not financial advice.
Disclosure: this article contains affiliate links. If you sign up through them, Trader Edge Hub may earn a commission at no extra cost to you. We only mention tools we think fit the topic. As an Amazon Associate, Trader Edge Hub earns from qualifying purchases.
Learning how to analyze a rental property protects your capital before making an offer. At Trader Edge Hub, we focus on objective numbers rather than emotional marketing claims. Evaluating rental deals requires verifying income, calculating operating expenses, and measuring cash yields accurately. Calculating net operating income, cap rates, and cash-on-cash returns helps you avoid overpaying.
Quick answer: Analyzing a rental property requires subtracting verified operating expenses from gross rent to find net operating income. You calculate cap rate by dividing net operating income by purchase price. Cash-on-cash return measures your annual cash flow against your actual cash invested including down payment and closing fees.
What does it mean to analyze a rental property?
Analyzing a rental property means evaluating property revenues and operating expenses objectively. We stress-test every assumption before committing capital to a deal. You must separate seller claims from verifiable market evidence.
To analyze a property properly, follow a four-block cash flow model. Big Mike Grant outlines these four blocks in 2026 guidelines. The blocks include gross income, operating expenses, financing costs, and tax obligations.
You must verify gross rental income using active local listings. Real-Estate Analyzer guidelines recommend checking three to five comparable properties. Match listings on bedroom count, square footage, and condition within a half-mile radius.
What is net operating income (NOI) and how do you calculate it?
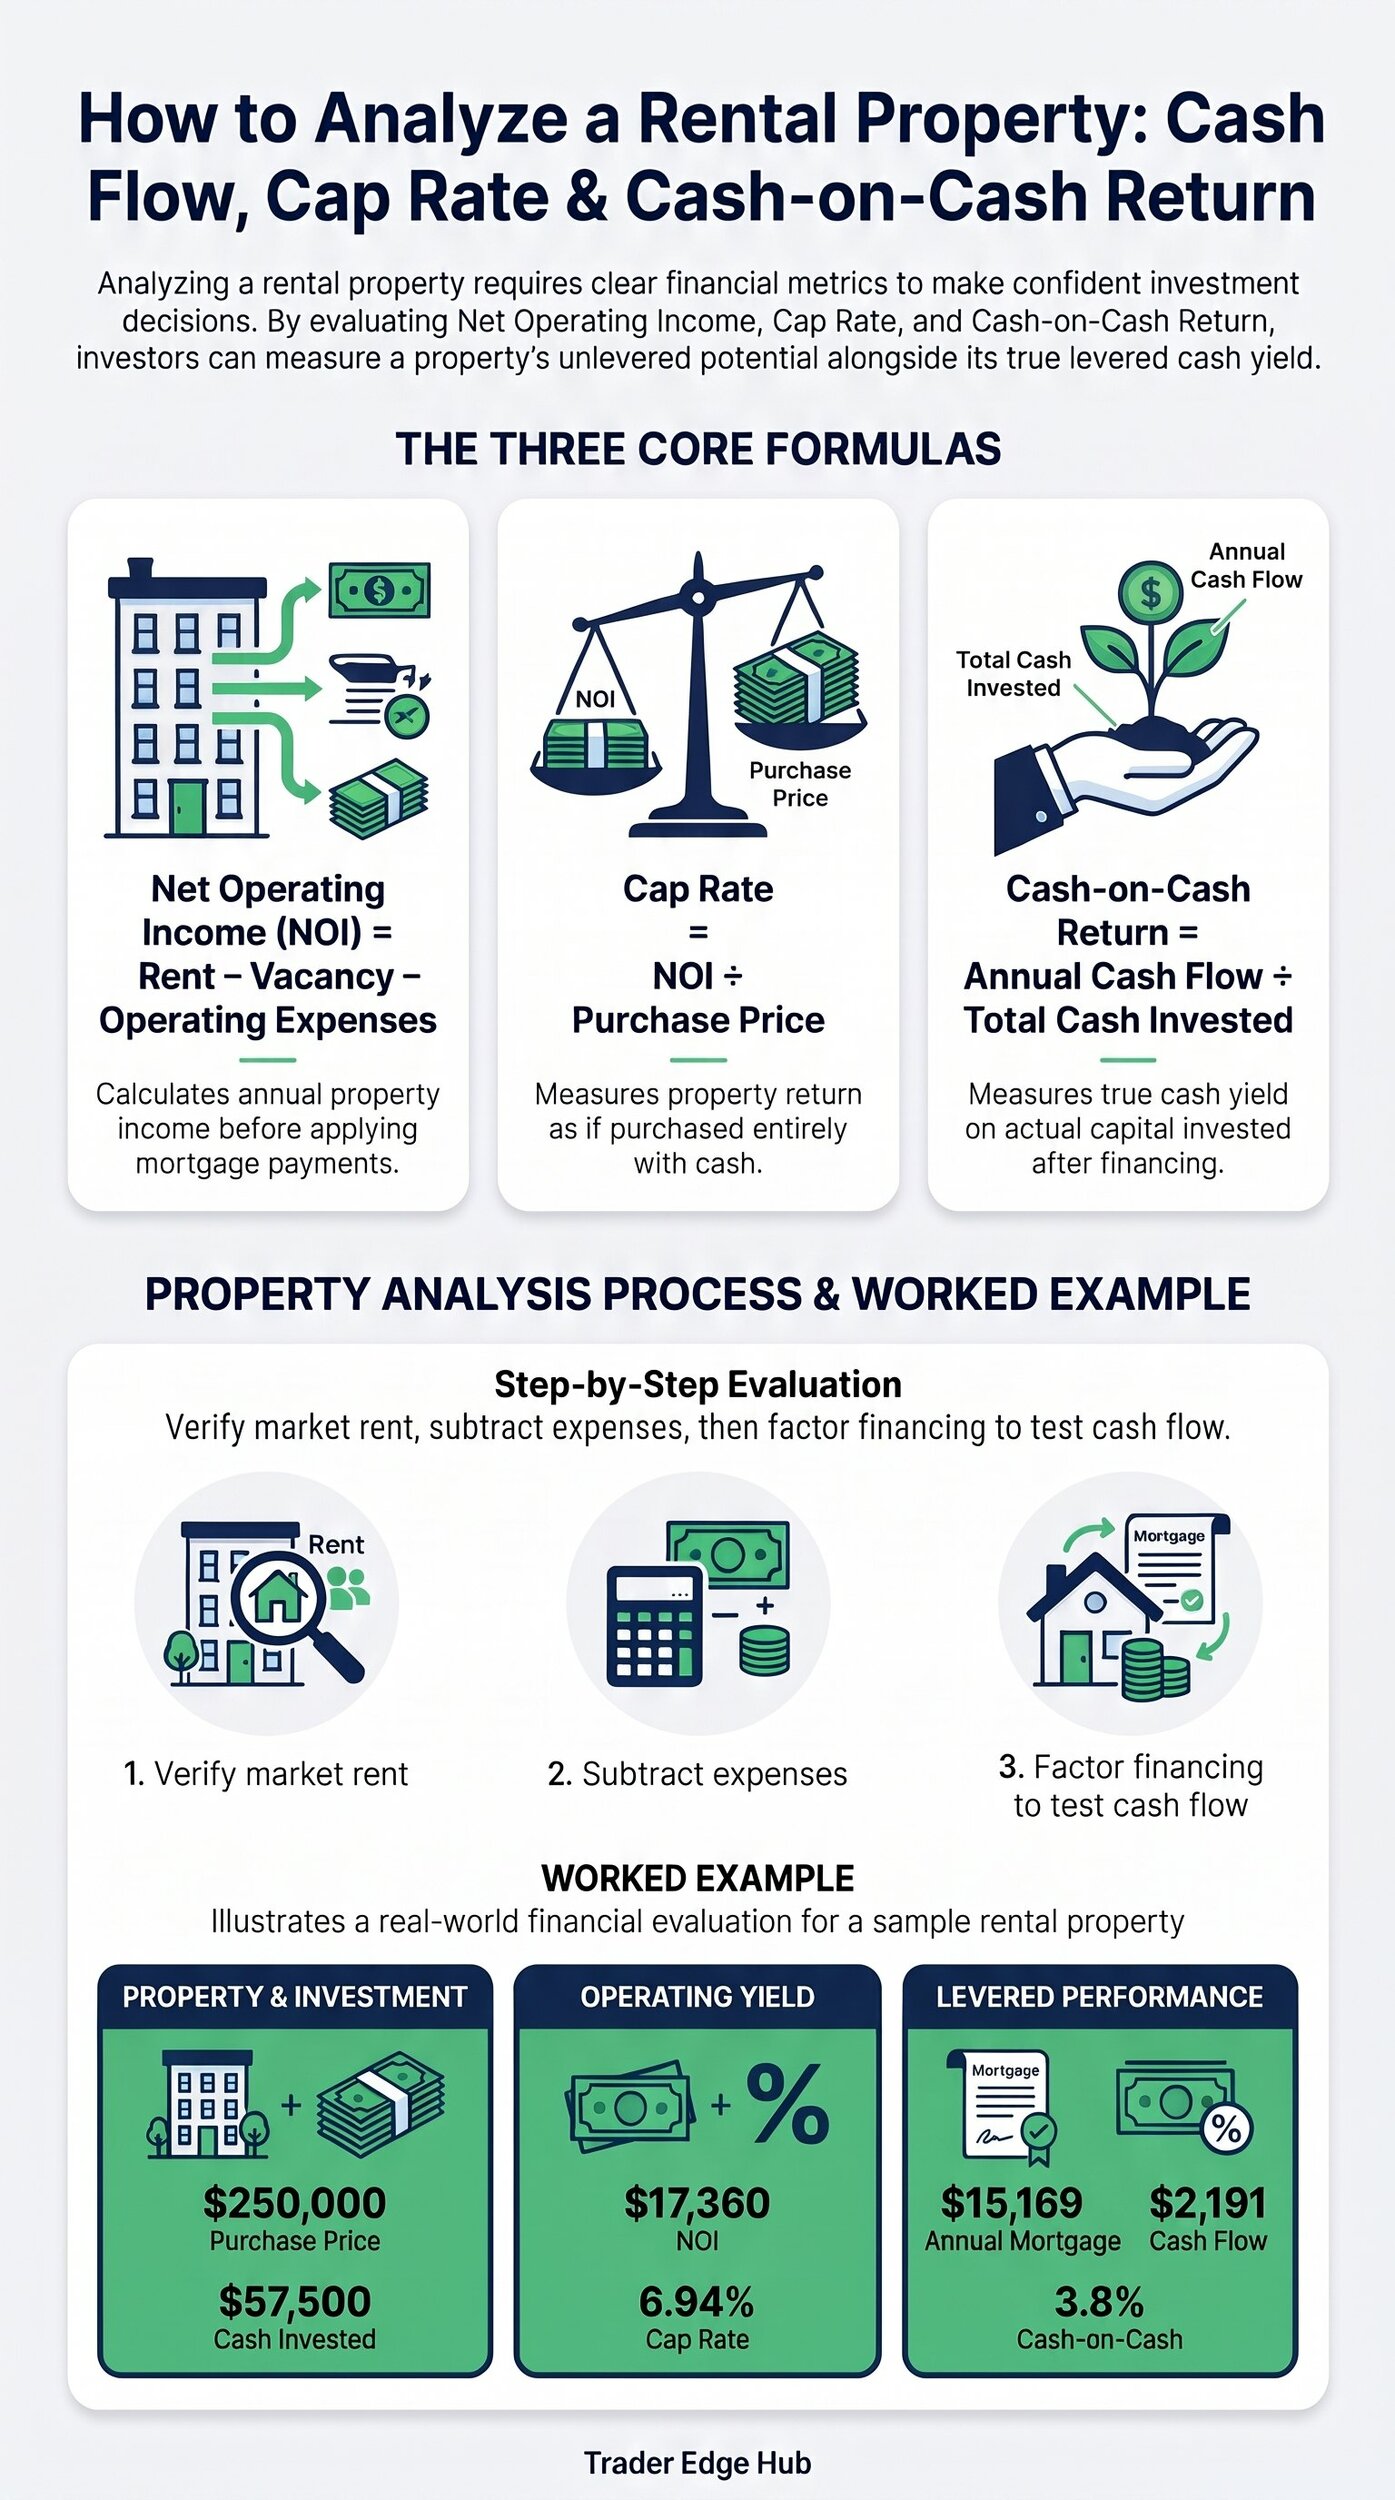
Net operating income [annual rental revenue minus operating expenses, before mortgage debt payments] measures core property performance. You calculate net operating income by subtracting operating costs from effective gross income. Effective gross income equals gross rent minus vacancy losses.
Vacancy allowances prevent overestimating annual rental revenue. Census Bureau survey data from Q1 2026 shows national rental vacancy at 7.3%. Regional Census data indicates 9.0% vacancy in the South and 5.2% in the Northeast.
Operating expenses typically consume 35% to 50% of gross rent. Real-Estate Analyzer guidelines confirm this standard baseline range. Operating costs include property taxes, landlord insurance, property management, and maintenance reserves.
Property management fees usually range between 5% and 10% of gross rent. MRI Software documentation details these standard fee structures. Tenant placement fees often equal half or full month rent.
| NOI Calculation Component | Financial Description | Supporting Source Baseline |
|---|---|---|
| Gross Scheduled Rent | Total annual rent if fully occupied every month | Real-Estate Analyzer |
| Less Vacancy Allowance | Deduction for uncollected rent and turnover days | Census Bureau Q1 2026 (7.3% National) |
| Effective Gross Income (EGI) | Gross rent minus vacancy allowance | Real-Estate Analyzer |
| Less Operating Expenses | Taxes, insurance, management, repairs, CapEx reserve | Real-Estate Analyzer (35%–50% of rent) |
| Net Operating Income (NOI) | Annual income remaining before mortgage debt payments | Landlord Studio |
What is a cap rate and what counts as a good one?
Capitalization rate [unlevered annual yield comparing net operating income to purchase price] evaluates property profitability. Calculate cap rate by dividing net operating income by property purchase price. The cap rate formula excludes mortgage financing entirely.
Cap rate expectations vary based on location and property risk. Landlord Studio benchmarks show typical cap rates range between 5% and 10%. Stable urban markets yield 4% to 6%, while mid-tier suburbs yield 6% to 8%.
Lower cap rates signal higher property demand and lower perceived risk. Conversely, higher cap rates reflect greater operating risks or deferred maintenance needs. Thomas Lawhun from New Life Capital Partners notes that cap rates vary across city tiers.
Pro tip: Use cap rate as an initial screening tool to compare property pricing across a city. Once you select a property, evaluate financing using cash-on-cash return to measure actual levered cash yields.
What is cash flow and why does it matter more than rent?
Cash flow [net dollars remaining each month after paying operating expenses and debt service] dictates investment survival. Calculate cash flow by subtracting monthly debt service from net operating income. Gross rent figures mean little if high operating costs consume revenues.
Beginners frequently confuse gross rental revenue with net cash flow profits. Academic Gain Tutorials demonstrates that a property collecting $2,200 in monthly rent can yield modest cash flow. In their model, monthly expenses totaling $2,026 leave $174 in net cash flow.
Debt service coverage ratio [ratio of net operating income to annual mortgage debt payments] evaluates loan safety. Real-Estate Analyzer guidelines state commercial lenders require a ratio of 1.25 or higher. A ratio below 1.0 means rental income fails to cover mortgage payments.
What is cash-on-cash return?
Cash-on-cash return [pre-tax annual cash flow divided by total actual cash invested] measures levered cash yield. Calculate cash-on-cash return by dividing annual pre-tax cash flow by total upfront cash spent. Total cash invested includes your down payment, closing costs, and initial repairs.
Closing costs add 2% to 5% to your purchase price requirements. The 2026 Closing Costs Guide confirms these transaction fee baselines. Buying a $250,000 home with 20% down ($50,000) and 3% closing costs ($7,500) requires $57,500 total cash.
Target cash-on-cash returns generally range between 8% and 12% for financed properties. Landlord Studio guidelines treat 8% as a standard baseline floor. Higher mortgage rates squeeze cash-on-cash returns when borrowing costs exceed property cap rates.
What does the 1% rule say and where does it fail?
The 1% rule [screening benchmark requiring monthly rent to equal at least 1% of total purchase price] filters listings quickly. Ephrata National Bank explains that a $100,000 property needs $1,000 monthly rent to pass the test. Estimate 1% by moving the price decimal point two places left.
Ephrata National Bank illustrates where the 1% rule succeeds and fails using two property examples. In their passing example, a $100,000 property renting for $1,000 yields $170 monthly cash flow. In their failing example, a $200,000 property renting for $1,000 produces a $260 monthly cash loss.
The 1% rule fails in high-cost housing markets where property prices exceed rental rates. Lofty AI data shows national price-to-rent ratios averaging around 16. In expensive coastal cities, ratios exceed 25, making 1% deals impossible to find.
Investors use secondary rules of thumb alongside the 1% rule for fast evaluation. Ephrata National Bank notes the 50% rule, while Red Rooster PM references budgeting $1.00 per square foot annually for maintenance.
Common mistake: Relying solely on the 1% rule to make purchase decisions. The 1% rule is an initial filter, not a substitute for complete cash flow modeling including taxes, insurance, and debt service.
How do you analyze a rental property step by step?
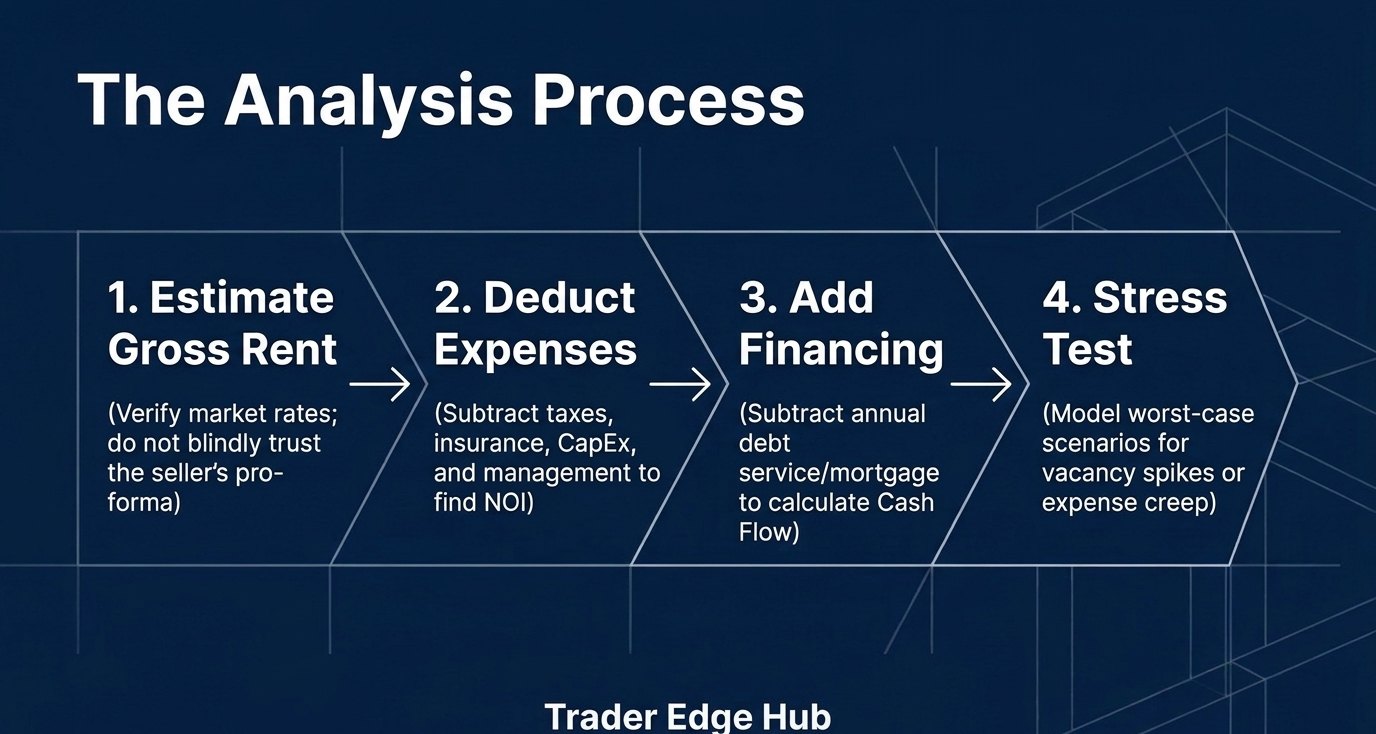
Analyzing a rental property requires a consistent evaluation process. At Trader Edge Hub, we use a six-step workflow to examine every deal.
- Gather property and income data: Collect rent rolls and verify market rental rates using active local listings.
- Estimate vacancy losses and gross income: Subtract a vacancy allowance from gross rent based on local market averages.
- Tally operating expenses: Deduct property taxes, insurance, management fees, maintenance, and capital reserves.
- Calculate net operating income (NOI): Subtract operating expenses from effective gross income to find unlevered property yield.
- Calculate debt service and cash flow: Subtract annual debt service from net operating income to determine net cash flow.
- Evaluate return metrics: Compute cap rate, cash-on-cash return, and debt service coverage ratio under conservative scenarios.
Following this sequence prevents skipping hidden costs. Compare property returns against stock strategies like building a simple 3-ETF portfolio to evaluate asset allocation.
What does a worked example look like in numbers?
To understand the math, examine a complete rental property calculation. Note that this calculation is illustrative only, not a forecast.
| Financial Metric | Value | Source & Notes |
|---|---|---|
| Purchase Price | $250,000 | Sample property acquisition price |
| Down Payment (20%) | $50,000 | Conventional investor loan requirement |
| Closing Costs (3%) | $7,500 | 2026 Closing Costs Guide baseline |
| Total Initial Cash Invested | $57,500 | Down payment plus upfront closing fees |
| Gross Scheduled Rent ($2,400/mo) | $28,800/yr | Verified local rent roll baseline |
| Less Vacancy Allowance (5%) | -$1,440/yr | Illustrative; national rate was 7.3% in Q1 2026 (Census Bureau) |
| Effective Gross Income (EGI) | $27,360/yr | Real-Estate Analyzer model |
| Less Operating Expenses | -$10,000/yr | Taxes, insurance, management, repairs |
| Net Operating Income (NOI) | $17,360/yr | Landlord Studio unlevered metric |
| Cap Rate | 6.94% | $17,360 NOI divided by $250,000 price |
| Mortgage Loan Terms | $200,000 loan at 6.5% for 30 years | Illustrative rate (Freddie Mac PMMS average was 7.24% on Oct 29, 2026) |
| Monthly Payment / Annual Debt Service | About $1,264/mo ($15,169/yr) | Standard 30-year fixed amortization |
| Annual Cash Flow | About $2,191 | $17,360 NOI minus $15,169 debt service |
| Cash-on-Cash Return | About 3.8% | $2,191 cash flow divided by $57,500 invested |
| Debt Service Coverage Ratio (DSCR) | About 1.14 | $17,360 NOI divided by $15,169 debt service |
| 1% Rule Screening Check | 0.96% ($2,400 / $250,000) | Ephrata National Bank rule (fails 1.0%) |
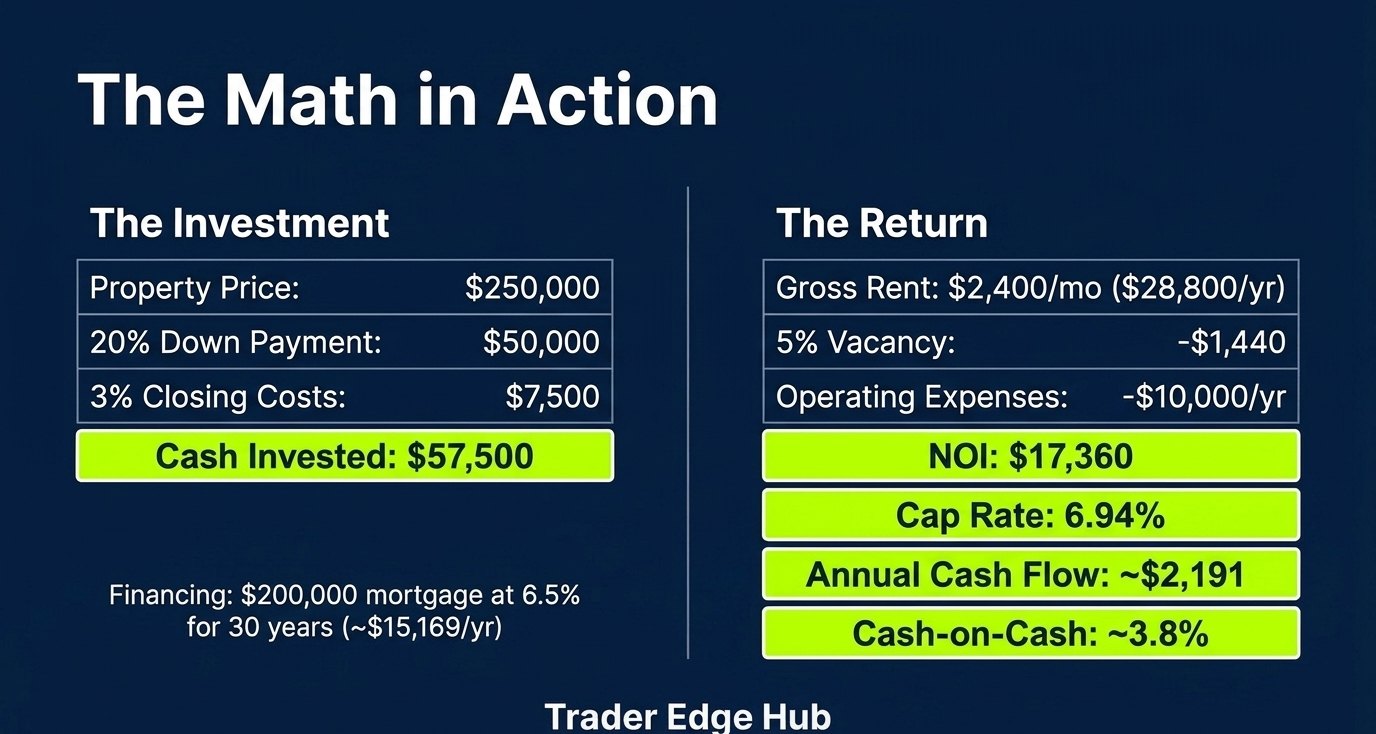
Leverage changes financial returns significantly. While property cap rate is 6.94%, borrowing at 6.5% yields a cash-on-cash return of about 3.8%. High borrowing costs reduce cash yields when loan rates approach property cap rates.
What changes if rent drops or interest rates rise?
Stress testing reveals cash flow sensitivity to market shifts. Small changes in monthly rent or mortgage interest rates alter investor returns. The table below illustrates three scenarios for our sample $250,000 property.
| Scenario Description | NOI & Debt Service Impact | Cash Flow & Cash-on-Cash Yield |
|---|---|---|
| Baseline ($2,400 rent, 6.5% rate) | NOI $17,360 | Debt Service $15,169 | Cash Flow $2,191 | Cash-on-Cash 3.8% |
| Rent Drops 5% ($2,280/mo rent) | NOI $15,992 | Debt Service $15,169 | Cash Flow $823 | Cash-on-Cash 1.4% |
| Interest Rate Rises to 7.24% (Freddie Mac) | NOI $17,360 | Debt Service $16,356 | Cash Flow $1,004 | Cash-on-Cash 1.7% |
When interest rates rise to 7.24% (Freddie Mac PMMS, October 29, 2026), cash flow falls to $1,004 annually. If rent drops 5%, cash-on-cash yield falls to 1.4%. Maintain cash reserves to manage revenue fluctuations.
To understand market dynamics during rate hikes, read our analysis on why bond prices fall when interest rates rise. Rate cycles impact both fixed-income assets and real estate borrowing costs.
What common mistakes do property investors make?
Avoidable errors undermine rental property returns. We track six frequent underwriting mistakes made by real estate buyers.
1. Underestimating maintenance reserves: Beginners often budget too little for repairs. Red Rooster PM recommends setting aside 1.0% of property value annually for maintenance.
2. Ignoring property management expenses: Managing tenants requires time and labor. MRI Software documentation notes management fees consume 5% to 10% of gross rent.
3. Using zero vacancy assumptions: Properties experience turnover and tenant search days. Census Bureau Q1 2026 data shows national vacancy averaging 7.3%. Assuming 100% occupancy leads to cash deficits.
4. Confusing cap rate with cash-on-cash return: Cap rate measures property performance without mortgage debt. Landlord Studio guidelines emphasize using cash-on-cash return to evaluate levered cash flow on invested capital.
5. Over-relying on the 1% rule filter: The 1% rule serves as an initial screening tool. Ephrata National Bank notes that passing the 1% rule does not substitute for full cash flow modeling.
6. Forgetting closing and transaction costs: Buying real estate requires upfront transaction capital. The 2026 Closing Costs Guide confirms closing fees add 2% to 5% to purchase cash requirements.
Which tools help you analyze rental properties?
Building a standardized spreadsheet using the six steps keeps your analysis consistent across properties. A structured sheet ensures you subtract vacancy and operating expenses before calculating cash yields.
If you want real estate exposure without being a landlord, REIT ETFs or REIT stocks can be bought in a brokerage app such as Robinhood. REIT prices can fall, and this is not a recommendation.
Kavout is a research and screening tool for listed stocks such as REITs. We mention it for education only.
Want a deeper walk-through? The Book on Rental Property Investing by Brandon Turner is a beginner-friendly guide to buy-and-hold rentals. Check the current price on Amazon.
For more detailed calculations on housing decisions, explore our guide on Rent vs Buy at 7% Mortgage Rates.
If you also invest in public funds, review our checklist on 10 things to check before you buy an ETF.
Test yourself
1. What does net operating income (NOI) measure?
A) Total rent collected
B) Annual income remaining after operating expenses, before debt payments
C) Net profit after paying income taxes
D) Total loan principal paid off
Answer: B. Net operating income measures core unlevered property income after deducting operating expenses from effective gross rent.
2. How do you calculate capitalization rate (cap rate)?
A) Divide annual cash flow by down payment
B) Divide gross rent by total loan amount
C) Divide net operating income by property purchase price
D) Multiply monthly rent by 12
Answer: C. Cap rate equals net operating income divided by purchase price, measuring unlevered annual property yield.
3. What was national rental vacancy in Census Bureau Q1 2026 data?
A) 2.1%
B) 5.0%
C) 7.3%
D) 12.5%
Answer: C. Census Bureau survey data from Q1 2026 reported a national rental vacancy rate of 7.3%.
4. Why does cash-on-cash return differ from cap rate on a mortgaged property?
A) Cash-on-cash return accounts for mortgage debt service and actual cash invested
B) Cap rate includes income taxes while cash-on-cash ignores them
C) Cash-on-cash return measures property square footage
D) Cap rate applies only to commercial office buildings
Answer: A. Cash-on-cash return measures levered cash flow against actual cash spent, whereas cap rate excludes mortgage debt.
5. What does a Debt Service Coverage Ratio (DSCR) of 1.14 indicate about a property?
A) Annual net operating income exceeds annual mortgage payments by 14%
B) Property taxes exceed monthly rental income
C) The owner loses money every month on debt payments
D) Mortgage debt is 114% higher than purchase price
Answer: A. A DSCR of 1.14 means net operating income covers annual mortgage debt payments with a 14% buffer.
FAQ
Why is net operating income calculated before mortgage payments?
Net operating income excludes mortgage debt service to measure core property performance independently. Landlord Studio guidelines explain that removing financing allows unbiased comparison between different properties across a market.
What is a good cash-on-cash return for a rental property?
Target cash-on-cash returns generally range between 8% and 12% for mortgaged properties. Landlord Studio benchmarks treat 8% as a baseline floor, though current high mortgage rates squeeze yields across many U.S. markets.
How does vacancy affect rental cash flow?
Vacancy reduces gross rental revenue directly and increases turnover costs. Census Bureau survey data shows national vacancy at 7.3% in Q1 2026, making vacancy deductions essential in cash flow underwriting.
What operating expense percentage should you assume?
Operating expenses typically consume 35% to 50% of gross rent according to Real-Estate Analyzer guidelines. This allowance covers property taxes, landlord insurance, maintenance, property management, and capital reserves.
Does passing the 1% rule ensure positive cash flow?
No, passing the 1% rule does not ensure positive cash flow. Ephrata National Bank notes the 1% rule is a screening tool that ignores specific property taxes, insurance rates, and high interest rates.
How do higher mortgage rates impact cash-on-cash return?
Higher mortgage rates increase annual debt service payments and lower net cash flow. When interest rates rise to 7.24% (Freddie Mac PMMS, Oct 2026), borrowing costs reduce cash-on-cash yields on levered purchases.
The verdict
Analyzing rental property numbers objectively protects your capital from bad deals. By calculating net operating income, cap rate, and cash-on-cash return, you evaluate true property yield before making offers.
Your immediate next step is creating a standardized spreadsheet using our four-block framework. Input local listing rents, tax records, and current mortgage rates to analyze your next rental deal with confidence.
Sources: Landlord Studio, Big Mike Grant, Census Bureau Q1 2026 Vacancy Survey, Real-Estate Analyzer, Red Rooster PM, MRI Software, Ephrata National Bank, Freddie Mac PMMS (Oct 29, 2026), 2026 Closing Costs Guide.
Real estate investing involves substantial risk. Money can be locked up and lost, and examples include vacancies, repairs and fees. This article is education, not financial advice.