
- Why streaks happen even with a positive edge
- The math behind losing streaks
- How long a streak to expect
- What a streak does to your account
- Why recovery is harder than the loss
- How many losses in a row can your account take?
- The psychology of a streak
- A five-step plan for a losing streak
- Normal variance or a broken strategy?
- Common mistakes
- FAQ
- How long can a losing streak last for a good trader?
- Should I stop trading during a losing streak?
- Why does my strategy seem to fail when I go live?
- How do I come back after a big drawdown?
- The verdict
Trading involves substantial risk of loss. This article is education, not financial advice.
Disclosure: this article contains affiliate links. If you sign up through them, Trader Edge Hub may earn a commission at no extra cost to you. We only mention tools we think fit the topic.
Every trader hits a run of losses that feels like proof the strategy is broken. Most of the time it is not. A losing streak (a string of consecutive losing trades) is built into how probability works, even for a strategy with a real edge. This guide shows how often streaks should happen, how long they typically run, what they do to your account at different risk sizes, and a step-by-step plan for getting through one without making it worse.
Quick answer: Losing streaks are normal. With a 50% win rate and independent trades, a run of five or more losses shows up in roughly 8 out of 10 stretches of 100 trades. Even a 60% win rate produces one in roughly 4 or 5 of every 10. The chance of N losses in a row on a given sequence is (1 − win rate) to the power N. Plan for the streak before it happens: risk 1% or less per trade, cut size when it starts, and review your journal before changing the strategy.
Why streaks happen even with a positive edge
Many beginners expect a good strategy to win steadily. Markets do not alternate neatly between wins and losses. Outcomes land in a random-looking order, much like a fair coin can land heads five times running without being rigged. A strategy with positive expectancy (an average gain per trade that is above zero) still produces strings of losers. Our guide on trading expectancy explains how to measure that edge.
Market conditions add to it. Strategies built for trends tend to struggle when the market turns choppy, and the other way around. A cluster of losses can simply mean conditions shifted. Accepting this up front is the first step to staying disciplined.
The math behind losing streaks
If each trade is independent and your win rate is p, the chance that any one trade loses is 1 − p. The chance of losing N trades in a row, starting from a given trade, is:
Formula: Probability of N losses in a row = (1 − win rate)N. At a 50% win rate, three losses in a row is 0.5 × 0.5 × 0.5 = 12.5%, and five in a row is about 3.1%.
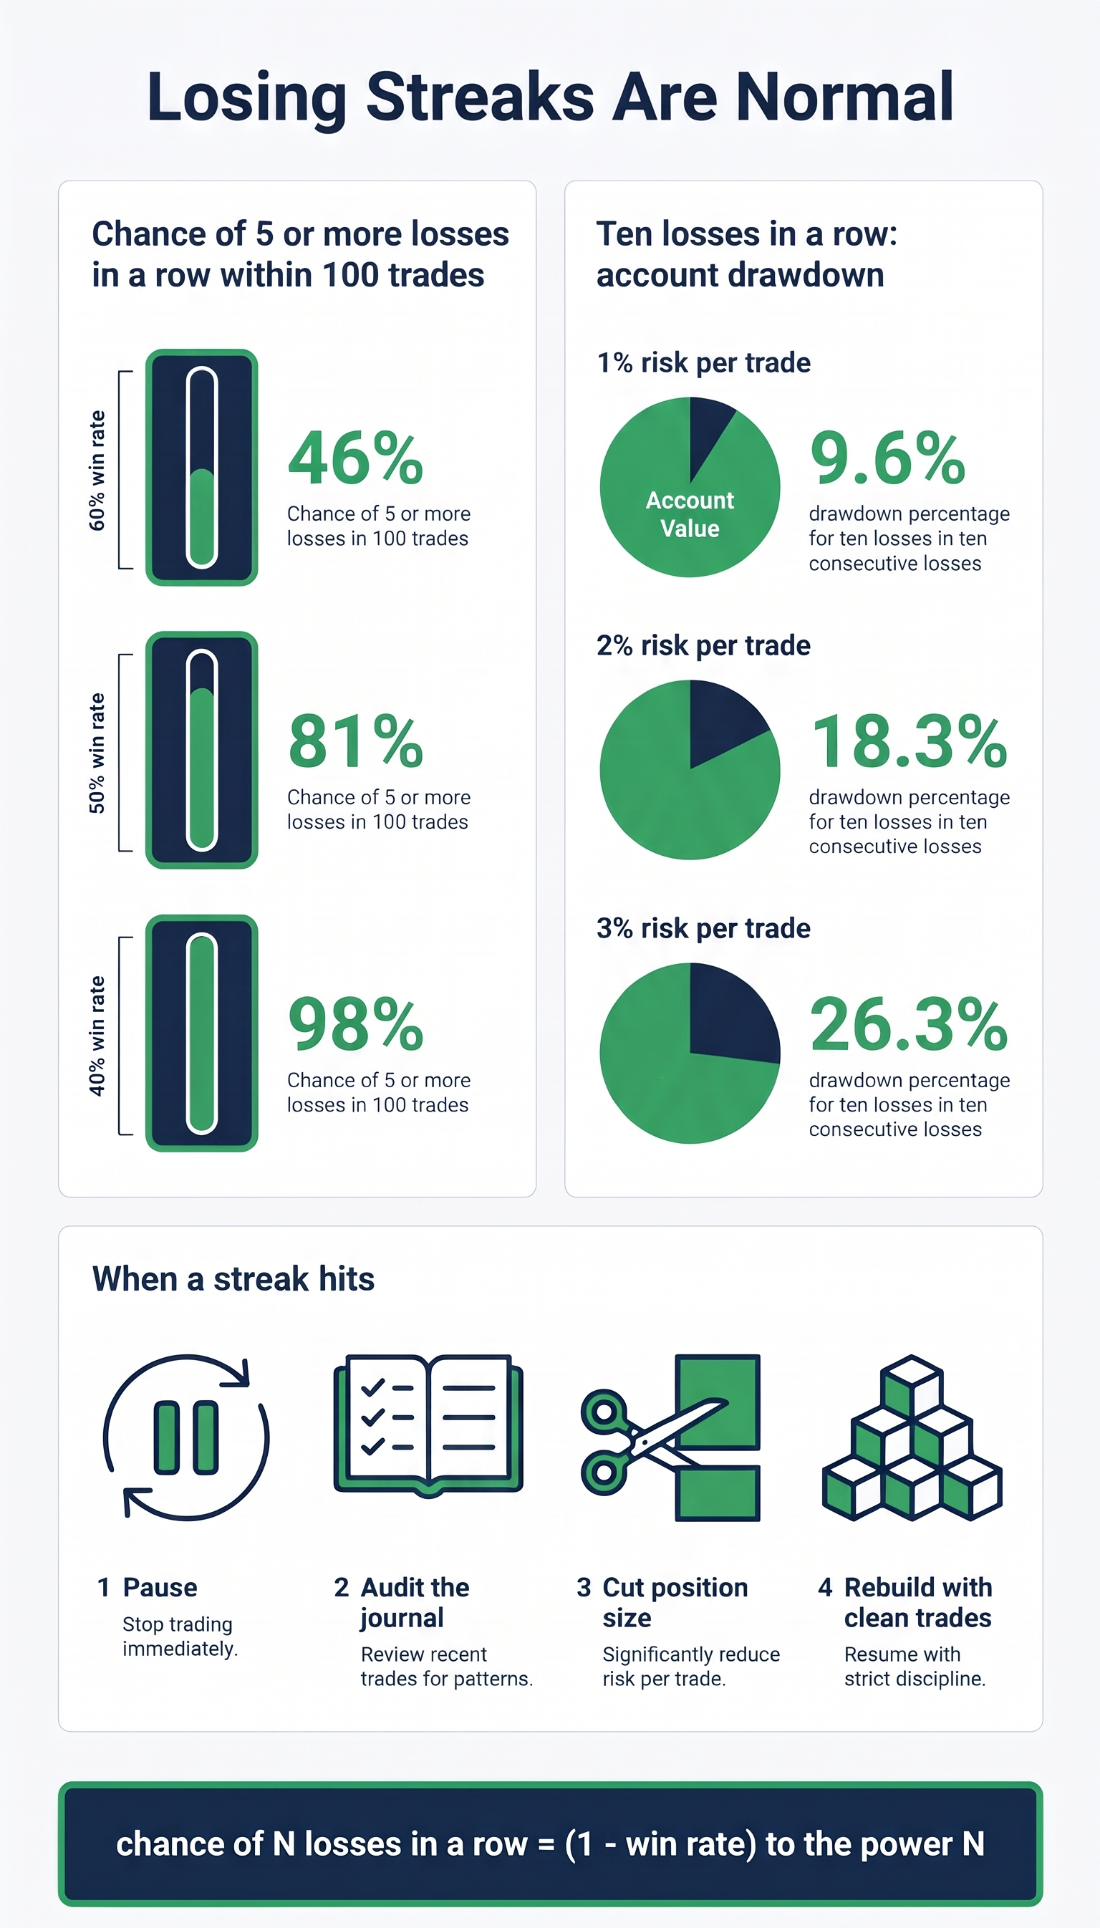
Those numbers look small, but you do not get one try. Over 100 trades the market gives a streak dozens of chances to start. The table below shows the chance of seeing at least one run of a given length somewhere in 100 consecutive trades. We calculated it from the formula above, assuming each trade is independent. Real markets are messier, so treat it as a guide, not a forecast.
| Win rate | 3+ losses in a row | 5+ in a row | 8+ in a row | 10+ in a row |
|---|---|---|---|---|
| 70% | 86% | 15% | under 1% | under 1% |
| 60% | 99% | 46% | 4% | 1% |
| 50% | ~100% | 81% | 17% | 4% |
| 40% | ~100% | 98% | 49% | 20% |
Look at the 60% row. A strategy that wins six times in ten has close to even odds of a five-loss run inside 100 trades. Even at 70%, a three-loss streak is more likely than not.
How long a streak to expect
Longer samples produce longer worst streaks. Our simulations of independent trades give these typical longest losing streaks:
| Win rate | Typical longest streak over 100 trades | Typical longest streak over 500 trades |
|---|---|---|
| 70% | about 3 to 5 | about 5 |
| 60% | about 4 to 5 | about 6 to 7 |
| 50% | about 6 | about 8 |
| 40% | about 7 to 8 | about 11 |
| 35% | about 9 | about 12 to 13 |
Those are typical results, not caps. Some samples run longer. That is why one practical rule of thumb, mentioned in the sources, is to take the longest losing streak in your backtest (a test of a strategy on past data), multiply it by about 1.5, and make sure you could survive a streak that long, both financially and emotionally.
What a streak does to your account
The damage depends on your position size. Because risking a fixed percentage shrinks your dollar risk as the account falls, the drawdown (the fall from a peak in account value) grows more slowly than a simple multiplication suggests. Here is the account after a run of consecutive full losses:
| Losses in a row | 1% risk per trade | 2% risk per trade | 3% risk per trade |
|---|---|---|---|
| 5 | 4.9% drawdown | 9.6% drawdown | 14.1% drawdown |
| 10 | 9.6% drawdown | 18.3% drawdown | 26.3% drawdown |
| 15 | 14.0% drawdown | 26.1% drawdown | 36.7% drawdown |
The math is (1 − risk)N. Ten losses at 1% leaves 0.9910, or about 90.4% of the account. At 3%, the same ten losses leave 0.9710, or about 73.7%. At 1% the streak is a bad month. At 3% it is a crisis. See our position sizing guide for how to set that risk.
Why recovery is harder than the loss
After a loss, your gains apply to a smaller balance, so the gain needed to break even is always bigger than the loss itself.
| Drawdown | Gain needed to recover |
|---|---|
| 10% | 11.1% |
| 20% | 25.0% |
| 30% | 42.9% |
| 37% | about 59% |
| 50% | 100% |
| 75% | 300% |
How many losses in a row can your account take?
You can turn the math around and ask how long a streak your risk setting can absorb. Pick the largest drawdown you could live with, then see how many consecutive full losses it takes to reach it. This table uses the same (1 − risk)N math as above.
| Risk per trade | Losses in a row to reach a 10% drawdown | Losses in a row to reach a 20% drawdown |
|---|---|---|
| 0.5% | 21 | 44 |
| 1% | 10 | 22 |
| 2% | 5 | 11 |
| 3% | 3 | 7 |
Compare that with the typical streaks earlier. A 50% win-rate strategy often runs six to eight losses in a row over a few hundred trades. At 1% risk you have room for that. At 3% risk, a perfectly ordinary streak can cost you more than a fifth of the account. The win rate you cannot change quickly, but the risk per trade you set yourself.
The psychology of a streak
Streaks hit your thinking as much as your balance. Three traps show up most:
- Loss aversion (feeling a loss more strongly than an equal gain). Research on loss aversion suggests losses can feel roughly twice as painful as equal gains feel good. This pushes traders to hold losers too long and cut winners too early.
- Revenge trading (taking bigger, unplanned trades right after a loss to get the money back fast). It is one of the quickest ways to turn a bad week into a blown account.
- Abandoning the plan at the bottom. After four or five losses the trader switches strategies, then misses the recovery that a normal run of results would have brought.
Because willpower is thinnest when you are stressed, it helps to have rules that act for you. That is where a daily loss limit and a drawdown rule come in.
A five-step plan for a losing streak
- Pause. Decide in advance how many losses in a row trigger a break, such as three or four. Step away for a day or two. Exercise or a walk helps clear your head.
- Audit your journal. Review every trade in the streak and sort each loss. A good loss followed the plan: valid setup, correct stop, the market simply did not cooperate. A bad loss broke the plan: you chased, oversized, or moved a stop. Our trading journal guide shows what to record.
- Classify the drawdown. Mostly good losses points to normal variance. Mostly bad losses points to an execution problem. A setup that has stopped working because the market changed points to a regime problem.
- Cut your size. Whatever the cause, reduce risk per trade. Dropping from 1% to 0.5% or 0.25% lowers the emotional weight of each trade and lets you focus on process.
- Rebuild with clean trades. Stay at reduced size until you have a sample of plan-compliant trades, for example 10 to 15, then step back up based on your journal, not your mood.
Normal variance or a broken strategy?
The hard question is whether the streak is noise or a sign the edge is gone. Judge it with data across timeframes, not with how the last five trades felt.
- Compare to the math. A four-loss run on a 65% win-rate system is routine.
- Check rolling results. Compare your win rate over the last month, three months and six months.
- Use flags. One simple framework is a yellow flag if the one-month win rate falls about 5 points below your longer baseline (cut size), and a red flag at about 10 points (pause the setup and re-test it on recent data). Treat the thresholds as a starting point you tune to your own strategy.
If your three-month and six-month numbers hold steady, the streak is most likely variance. Trust the sample and stay with the plan. If trades after the streak look different from the trades before it, such as a different market or a different kind of setup, that is worth investigating. Also remember that a small sample proves little. Plan to gather at least 30 to 50 live trades before judging a new strategy.
Common mistakes
Common mistake: Changing the strategy after three or four losses. That is too small a sample to tell variance from a real problem, and you may drop a method that was working.
Common mistake: Raising risk to "get it back." Larger size turns a normal streak into a deep drawdown, as the table above shows.
Pro tip: Write your streak plan before you need it: the number of losses that triggers a pause, the size you will cut to, and the number of clean trades you need before sizing back up.
FAQ
How long can a losing streak last for a good trader?
Longer than most expect. Over 100 trades at a 60% win rate, a run of five losses is close to a coin flip. Lower win-rate trend strategies see even longer runs, and our table shows a 35% win rate typically producing a streak of about 9 over 100 trades.
Should I stop trading during a losing streak?
Pause if you hit your daily or weekly loss limit, or if your journal shows you are breaking rules. If your losses followed the plan, many traders simply reduce size and keep executing.
Why does my strategy seem to fail when I go live?
Slippage, spreads, fees, changing market conditions and plan-breaking behavior all play a part. Judge a strategy on a meaningful sample of live trades, not a handful.
How do I come back after a big drawdown?
Take a break, audit your journal to learn whether it was a strategy problem or an execution problem, and rebuild at small size or on a demo account before returning to full risk.
The verdict
Losing streaks are a cost of trading, not a sign that you failed. Keep risk small enough that the longest streak you can reasonably expect leaves you in the game, write the response plan in advance, and use your journal to tell noise from signal. Your next step: look up your win rate over your last 50 trades and check it against the streak table to see what your account can survive.
Trading involves substantial risk of loss. This article is education, not financial advice.
Further reading: Losing streaks are where most traders abandon a sound plan. Mark Douglas's Trading in the Zone explains why any single trade's outcome is random and how to keep executing anyway. Check the current price on Amazon.
As an Amazon Associate, Trader Edge Hub earns from qualifying purchases.