
In the world of trading, there are countless strategies, indicators, and patterns that traders use to make predictions about future price movements. However, only a few of these methods offer the level of precision and high reward-to-risk ratio that the Gartley pattern can provide. Despite its reliability and accuracy, the Gartley pattern remains underused by many traders, making it an ideal choice for those looking to gain an edge.
In this blog post, we'll dive deep into the Gartley pattern—what it is, how to identify it, and the strategies for trading it effectively. By the end of this guide, you’ll have a comprehensive understanding of one of the most powerful harmonic patterns in trading.
What is the Gartley Pattern?
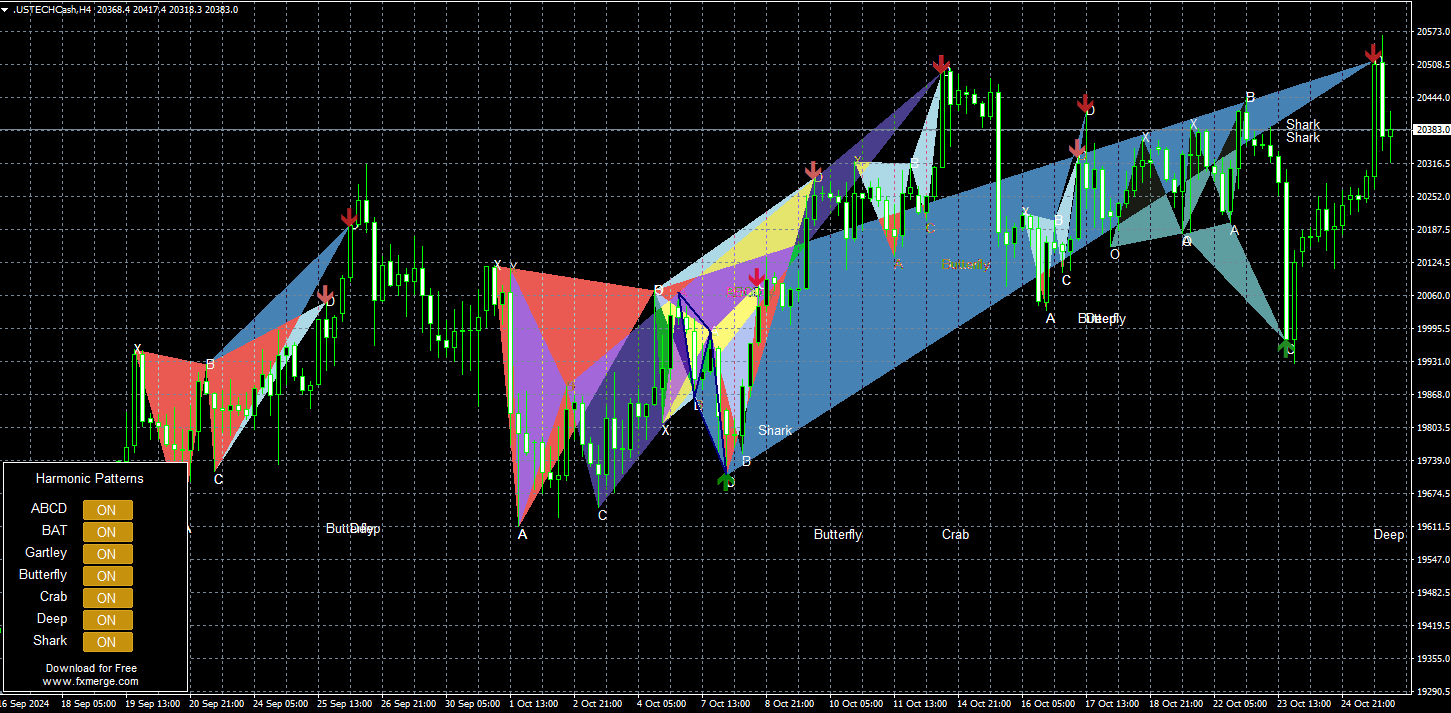
The Gartley pattern is a type of harmonic pattern that resembles an "M" or "W" shape, depending on whether it’s a bullish or bearish setup. It consists of five key points on a price chart, labeled X, A, B, C, and D. This pattern offers traders a low-risk entry point with a high potential for profit, making it highly effective in both trending and consolidating markets.
The Gartley pattern was introduced by H.M. Gartley in his book Profits in the Stock Market (1935), but it gained widespread recognition with the work of later analysts, particularly due to its basis in Fibonacci ratios. The pattern provides specific conditions and a structured approach, allowing traders to identify potential reversals with precision.
Key Elements of the Gartley Pattern
Each component of the Gartley pattern relies on Fibonacci retracement and extension levels. Let’s break down each swing in the pattern to understand how they relate to each other:
1. X to A Swing
- The first movement (X to A) represents a strong, decisive move, either up or down. This initial swing sets the stage for the rest of the pattern but doesn't adhere to any specific Fibonacci requirement.
- X to A is the longest leg in the pattern.
2. A to B Swing
- This leg is a retracement of the XA leg and should reach around 61.8% of the XA movement. The A to B leg should never retrace past point X, or the pattern becomes invalid.
3. B to C Swing
- The B to C leg is another retracement, either 38.2% or 88.6% of the A to B leg. If the B to C swing goes beyond point A, it invalidates the pattern.
4. C to D Swing
- The final leg in the pattern, C to D, is an extension of the B to C swing. It should reach either 127.2% if BC is 38.2% of AB, or 161.8% if BC is 88.6% of AB.
- The overall movement from A to D should measure 78.6% of XA, completing the pattern.
Identifying these key components may sound complicated, but using tools like TradingView can make the process easier. By marking points X, A, B, C, and D on your chart, you can visually confirm that each leg meets the required Fibonacci ratios before considering it a valid Gartley.
The Ideal Gartley Pattern
The ideal Gartley pattern adheres to strict Fibonacci levels:
- Point B should be a 61.8% retracement of the XA leg.
- Point C should be a retracement of either 38.2% or 88.6% of AB.
- Point D should complete at 0.786 of XA, ideally aligning with the 127.2% or 161.8% Fibonacci extension of BC.
These ratios are essential to the accuracy of the Gartley pattern and ensure that traders are entering at a point where the probability of a successful trade is higher.
Types of Gartley Patterns
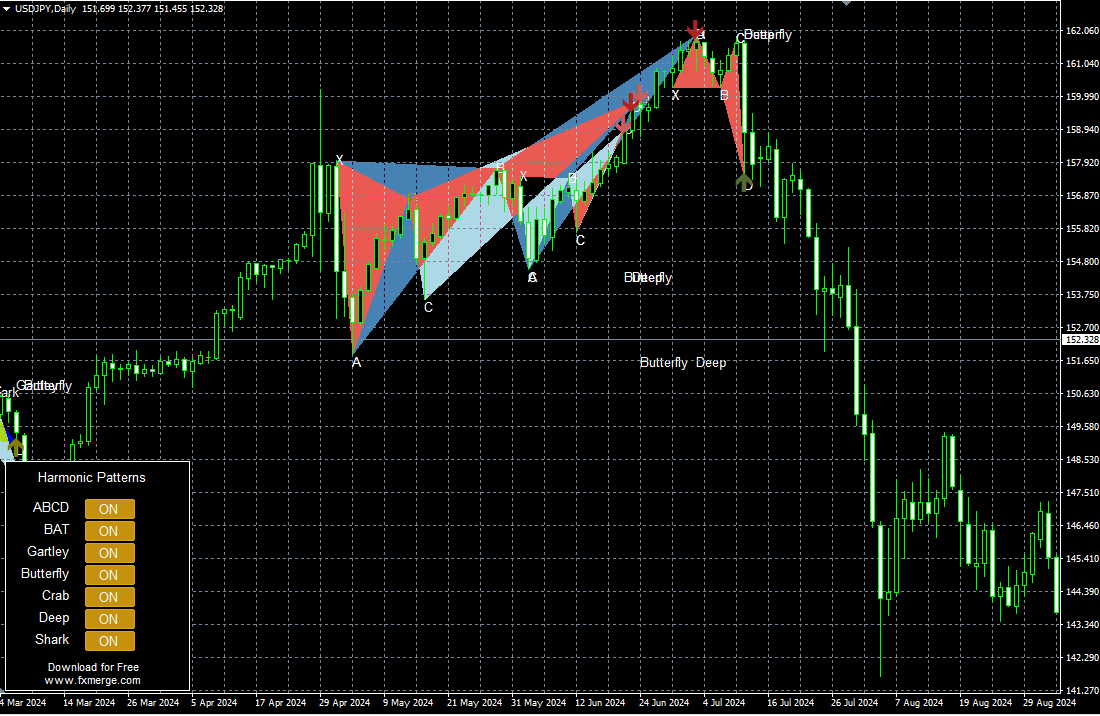
There are two types of Gartley patterns: bullish and bearish.
Bullish Gartley Pattern
- Structure: The pattern starts with an initial bullish XA move. This is followed by a bearish AB retracement, a bullish BC move, and a final bearish CD leg.
- Entry Point: Traders look to enter a long position at point D when the CD leg finds support around the 127.2% or 161.8% extension of BC.
- Targets: Typical target levels are:
- Target 1: B swing
- Target 2: C swing
- Target 3: A swing
- Target 4: 161.8% of AD
Bearish Gartley Pattern
- Structure: The bearish Gartley pattern has a bearish XA leg, a bullish AB retracement, a bearish BC move, and a final bullish CD move.
- Entry Point: Traders enter a short position at point D if CD forms resistance around the 127.2% or 161.8% extension of BC.
- Targets: Similar to the bullish pattern, the targets are:
- Target 1: B swing
- Target 2: C swing
- Target 3: A swing
- Target 4: 161.8% of AD
How to Trade the Gartley Pattern
Trading the Gartley pattern involves identifying the pattern and confirming it before entering a trade.
- Identify the Pattern: Draw the four price swings (X, A, B, C, D) and check that each swing meets the necessary Fibonacci retracements and extensions.
- Confirm the Pattern: Validate the pattern by ensuring each leg adheres to the Fibonacci rules mentioned above. This confirmation is crucial for reducing false signals.
- Enter the Trade:
- For Bullish Gartley: Place a buy order at point D, where CD completes its extension of BC.
- For Bearish Gartley: Place a sell order at point D, where CD completes its extension of BC.
- Set a Stop-Loss:
- For a bullish Gartley, place the stop-loss below point X.
- For a bearish Gartley, place the stop-loss above point X.
- Define Profit Targets: Scale out of the trade at each target level. The primary targets are B, C, and A swings, with the final target at 161.8% of the AD move.
Advanced Gartley Trading Strategies
For more experienced traders, there are additional methods to enhance the Gartley pattern’s effectiveness.
1. Gartley After a Strong Price Move
- When the Gartley forms after a significant price move, it’s more likely to signal a meaningful trend continuation.
- For instance, if a bullish Gartley forms following a major sell-off, it often indicates that the market has found a temporary bottom, and a bullish trend may follow.
2. Using Confluence Zones
- The Gartley pattern is more effective when it aligns with other technical indicators, such as support and resistance zones, moving averages, or candlestick patterns.
- A bullish Gartley pattern forming near a major support level can strengthen the probability of a successful trade.
3. Combining Volume Analysis
- Volume analysis can enhance Gartley trading by providing insights into the strength of price movements.
- For example, a bullish Gartley supported by high buying volume at point D indicates strong buying interest, supporting a long trade.
Learn more (affiliate link).
Why the Gartley Pattern Works
The Gartley pattern is powerful because it combines Fibonacci retracements, a widely used technical indicator, with precise entry and exit criteria. Since Fibonacci retracement levels are visible to many traders, they create self-fulfilling levels where buying or selling pressure accumulates, making the Gartley pattern highly reliable.
Another reason the Gartley pattern works well is that it focuses on the confluence of multiple Fibonacci ratios. When several Fibonacci levels align, they create a stronger potential reversal zone (PRZ) that gives traders confidence in the pattern’s predictive power.
Final Tips for Trading the Gartley Pattern
- Practice Identifying Patterns: Use charting software to mark Gartley patterns across different timeframes. The more patterns you identify, the easier it will be to spot them in real-time.
- Combine with Other Indicators: Adding trendlines, moving averages, or oscillators can provide additional confirmation.
- Always Use a Stop-Loss: No matter how confident you feel about a Gartley pattern, market volatility can lead to unexpected outcomes.
- Backtest Thoroughly: Before committing to a live trade, backtest your Gartley setups to see how effective they have been historically on your selected trading instruments.
Conclusion
The Gartley pattern is one of the most effective harmonic patterns available to traders. With its precise Fibonacci-based structure, it offers clear conditions for entry, exit, and risk management, making it ideal for traders looking for high-probability trades.
While it may seem complex initially, with practice and experience, identifying and trading the Gartley pattern becomes second nature. By combining this pattern with additional technical analysis tools and risk management strategies, you can leverage its potential to enhance your trading success. Whether you’re a seasoned trader or new to harmonics, the Gartley pattern is a valuable addition to any trader’s toolkit.
This article is for educational purposes only and is not financial advice. Trading involves a high risk of loss.